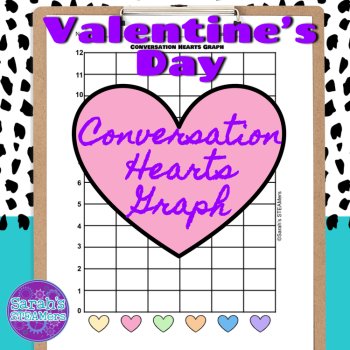
Valentine's Day Conversation Hearts Graphing Activity

$3.25 (62)

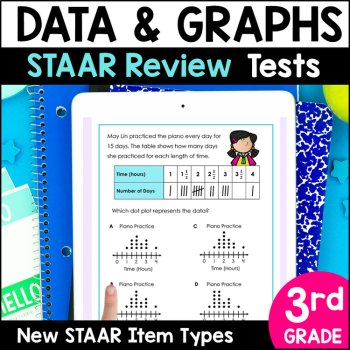
3rd Grade Data & Graphs TEKS Tests - Printable PDF and Digital Google Forms
(14 ratings)$4.00
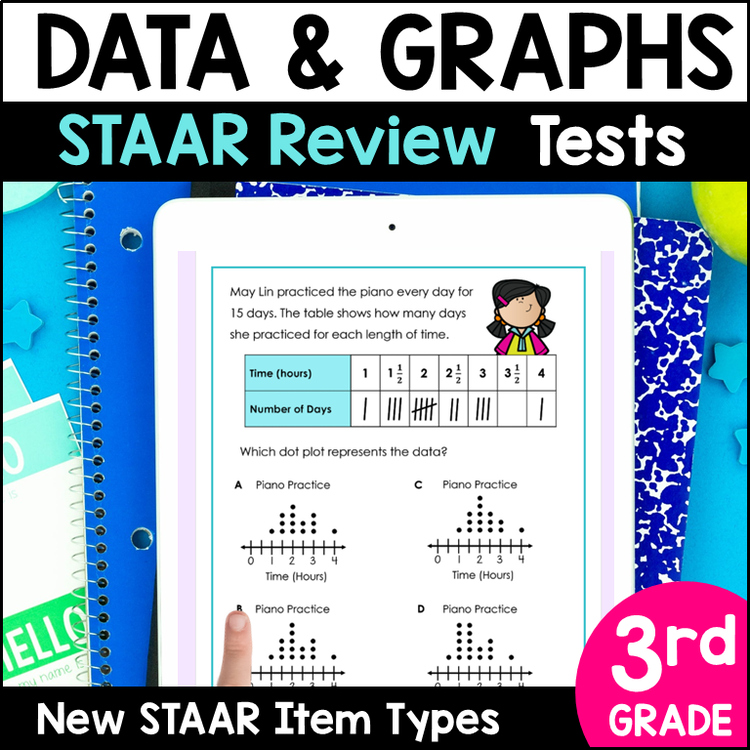
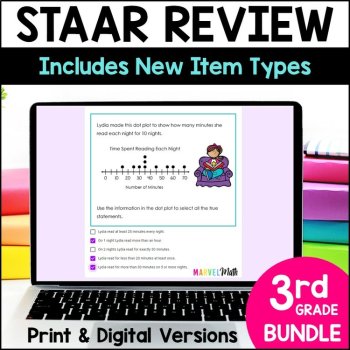
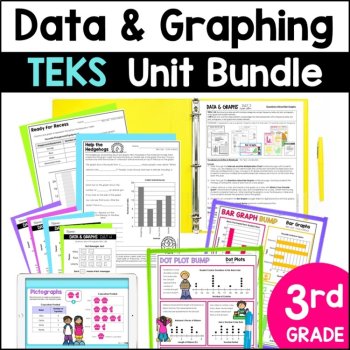
Add to cartThis resource includes 2 ten question Assessments for the Data and Graphs TEKS. The questions are STAAR formatted. Test questions cover Bar Graphs, Pictographs, Dot Plots and Frequency Tables. The assessments are in 2 formats: printable PDF and digital, self-grading Google Forms.
The assessments are created to give you meaningful feedback on student progress with all Data & Graphing Content. There are more questions covering the Readiness Standards than the Supporting Standards, as the Readiness Standards are identified as the most critical content for success in subsequent grade levels. Readiness Standards also comprise 2/3 of the STAAR test.
These tests were created with the new STAAR test questions guidelines in mind, and include drop down, multi-select, free response and multiple choice questions.
What's Included?
Topics include:
These tests coordinate with the content covered in this set of Task Cards and these resources work well together!
How Can I Use this Resource?
TEKS Alignment:
Readiness Standard
3.8A Summarize a data set with multiple categories using a frequency table, dot plot, pictograph, or bar graph with scaled intervals.
Supporting Standard
3.8B Solve one- and two-step problems using categorical data represented with a frequency table, dot plot, pictograph, or bar graph with scaled intervals.
Report this resource to Linked Through Learning
Reported resources will be reviewed by our team. Report this resource to let us know if this resource breaks our rules.
“This was a great resource for me, when our current curriculum was lacking in useful information from the assessment of data and graphs.”
“I used this as an assessment piece for my students. Thank you!”
4.8
14
ratings
No reviews match. Try other filters.
No questions yet.

Meet the Seller
In addition to my work in education, I also run a STEM-based Christmas Light Show business. When I'm not creating new math resources or working with teachers, I'm designing and fabricating light shows sequenced to music with my husband and our team. That business came about after our family was featured on ABC's The Great Christmas Light Fight. My son attends the University of Texas, Austin and I'm currently soaking up every last minute with my daughter, a high school senior.
San Antonio, Texas
 Unlocking Potential Educational Services,LLC
$3.95
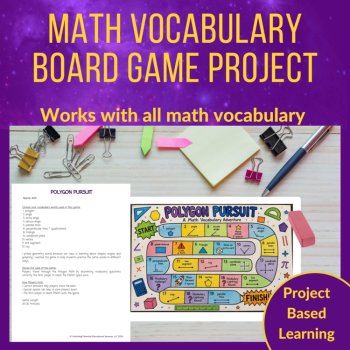
AI Assisted
The seller says AI was used in making this resource, but didn't add details.
Unlocking Potential Educational Services,LLC
$3.00
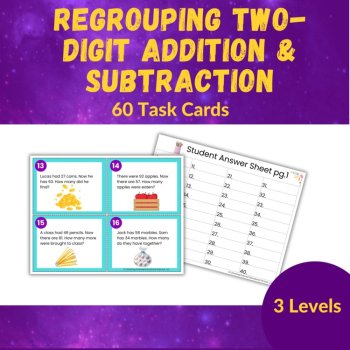
AI Assisted
Used AI to brainstorm word problems.
Unlocking Potential Educational Services,LLC
$1.00
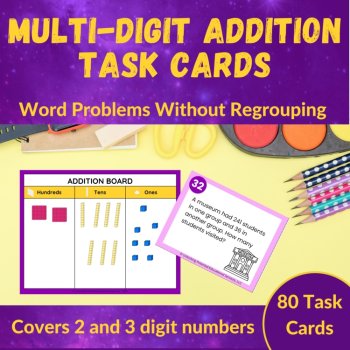
Unlocking Potential Educational Services,LLC
$4.95
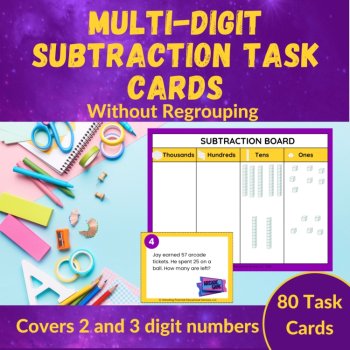
AI Assisted
Used AI to brainstorm word problem ideas.
Unlocking Potential Educational Services,LLC
$4.95
AI Assisted
Used AI to brainstorm word problem ideas.
Unlocking Potential Educational Services,LLC
$4.95