History of DNA Slides + Student Worksheet
 Ms Kiaras Science Teacher Shoppe
$4.00

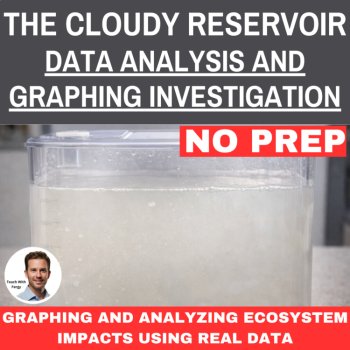
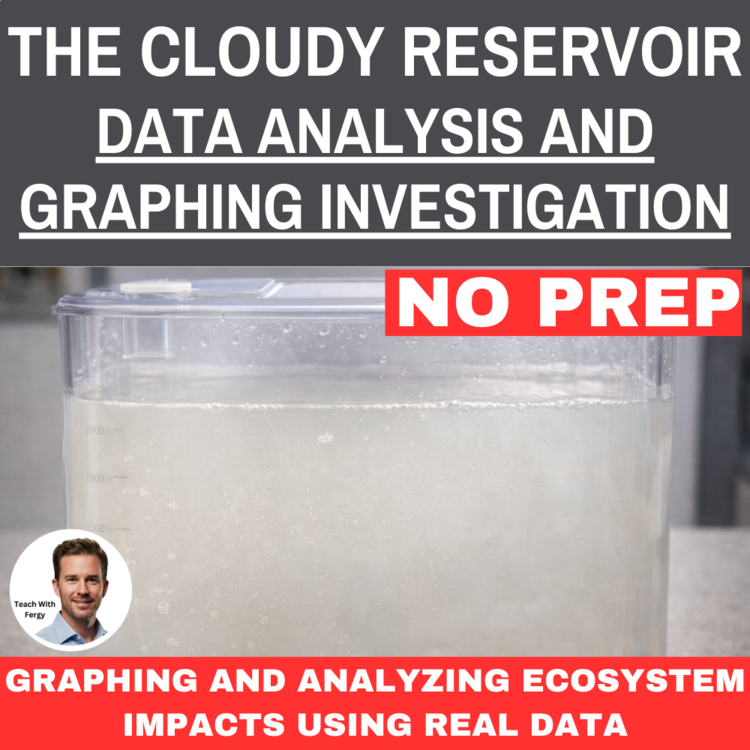
Turn your classroom into a water quality investigation lab.
In this Environmental Science Data Investigation, students analyze real-world style datasets to determine why the city’s drinking water reservoir has become unusually cloudy.
Through graphing, trend analysis, and structured evidence evaluation, students uncover the most likely cause of the change in water quality.
This is not a simple reading or worksheet.
Students actively:
What Students Learn
Students explore and understand:
This investigation connects erosion, stormwater runoff, and ecosystem impacts in a meaningful, data-driven way.
What’s Included
How Teachers Use This Bundle
Each case can be completed in 1–2 class periods.
Why Teachers Love the Format
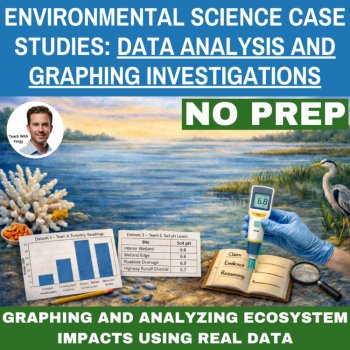
You can find this activity inside my Environmental Science Data Analysis and Graphing Investigations Bundle which currently includes:
✔ The Fish Kill at Riverbend Creek
✔ The Algae Bloom at Lake Greenwood
✔ The Cloudy Reservoir Case
✔ The Dying Wetland Plants Investigation
✔ The Coral Reef Bleaching Case
Standards Alignment
Supports NGSS Science & Engineering Practices:
Crosscutting Concepts:
Disciplinary Core Ideas:
Climate and environmental change
Designed For
Students don’t just read about environmental problems — they analyze the data, evaluate the evidence, and determine what actually happened.
If you have any questions, feel free to email me at devon@teachwithfergy.com
Report this resource to Linked Through Learning
Reported resources will be reviewed by our team. Report this resource to let us know if this resource breaks our rules.
No questions yet.

Meet the Seller
Middle and High School Science Engaging Resources
I have been selling resources to middle and high school teachers for the last 15 years. During that time I've also been in the classroom so I know what works and what will help your students the most.
Canada

$32.50 $50.00 (398)

$22.50 $34.50 (169)
$18.50 $36.50 (84)