
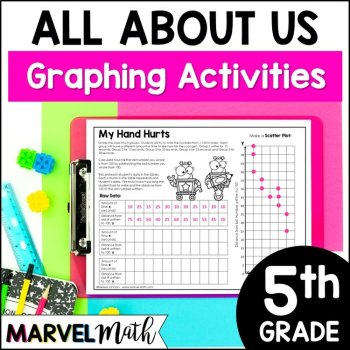
5th Grade Graphs and Data Book: Scatterplots, Stem and Leaf Plots, and Dot Plots
(83 ratings)$2.50
Add to cart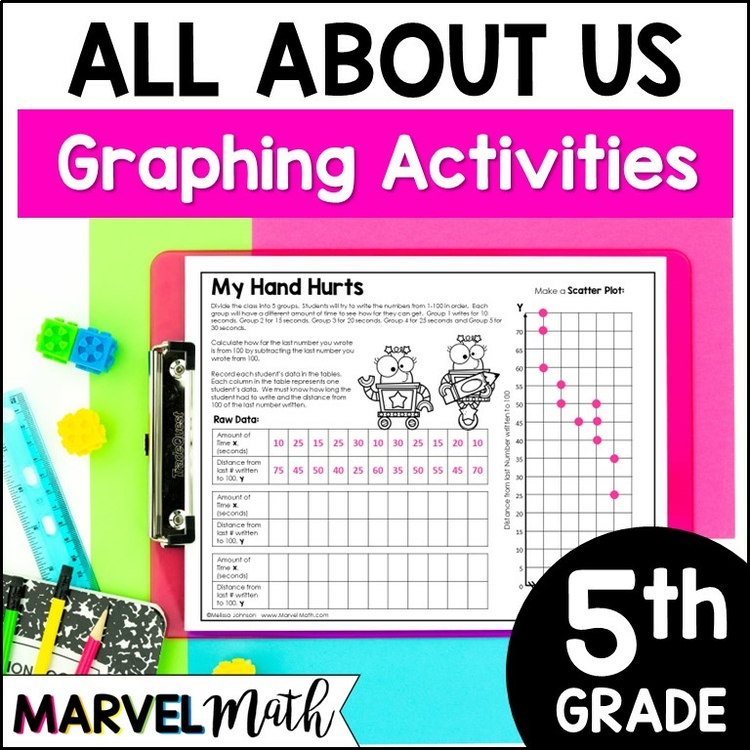
Description
This SUPER FUN graph and data book covers scatterplots, dot plots, stem and leaf plots and frequency tables and will give your students meaningful, hands-on experience collecting, reporting, graphing and analyzing data!!! Students do fun activities, like seeing how many times they can snap in 10 seconds and then use the data from the class to create scatterplots, dot plots, stem and leaf plots and frequency tables and covers these TEKS: 5.9A, 5.9B, & 5.9C.
Your students will love collecting data, organizing their raw data and then building graphs such as scatterplots, dot plots, and stem and leaf plots. Students remember content that is tied to a meaningful experience, and they will develop a lasting ability to create these important graphs.
This is a No Prep resource. All you need to do is print!
*****************************************************************************
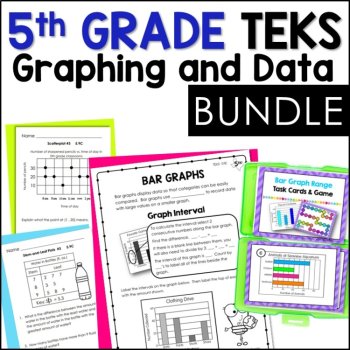
This resource is part of my 5th Grade TEKS aligned Data & Graphs Bundle:
5th Grade TEKS Graphs & Data Bundle
This resource is designed to work seamlessly with these other resources included in the bundle:
Bar Graph Task Cards
TEKS Aligned Exit Slips: Data & Graphs 5.9A, 5.9B, 5.9C
TEKS Aligned Notebook Pages: Data & Graphs 5.9A, 5.9B, 5.9C
Stem-and-Leaf Plot: Hands on Cut & Paste Activity
*****************************************************************************
Students will participate in a series of challenges, such as snapping for 10 seconds, or use survey questions to collect data and then use their peers' data to create graphs. Students will also answer one and multi-step questions about their dot plots, scatterplots, and stem-and-leaf plots. This is a perfect activity to use for introducing or reviewing 5th grade graphs.
I have included a page of questions that go with each graph. There is no key, because the answers depend upon your class data. There are at least two graphing activities for each type of graph. You may choose to do the first activity and question set as a guided lesson and then collect data for the second activity as a class and allow students to complete the second activity with a partner or independently.
Have fun collecting, organizing and displaying data about your class!
*****************************************************************************
Pg. 1: Cover
Pg. 2: Teaching Notes
Pgs. 3-5: Dot Plots with whole numbers and fractions (Thumbs Up, We Love our Pets, Pick a Number)
Pgs. 6-7: Stem & Leaf Plots (Snap in 10 & Raise an Eyebrow)
Pgs. 8-9: Scatterplots (Work It: Jumping Jacks & My Hand Hurts)
*****************************************************************************
Copyright Melissa Johnson, 2017
Marvel Math
Report this resource to Linked Through Learning
Reported resources will be reviewed by our team. Report this resource to let us know if this resource breaks our rules.
Teacher reviews
“Great to learn about data in real life! Fun and engaging”
“Great resource to review concepts for my resource class.”
Also included in
Reviews
4.9
83
ratings
No reviews match. Try other filters.
Questions & Answers
Sign in to ask a questionNo questions yet.
Meet the Seller
In addition to my work in education, I also run a STEM-based Christmas Light Show business. When I'm not creating new math resources or working with teachers, I'm designing and fabricating light shows sequenced to music with my husband and our team. That business came about after our family was featured on ABC's The Great Christmas Light Fight. My son attends the University of Texas, Austin and I'm currently soaking up every last minute with my daughter, a high school senior.
San Antonio, Texas
- 4.88Store rating after 24.5K reviews
- 1Follower
- Wal-Mart Teacher of the Year Educator of the Year, Henderson Elementary Central Unified Above and Beyond the Call of Duty Award Y101 Teacher of the Week