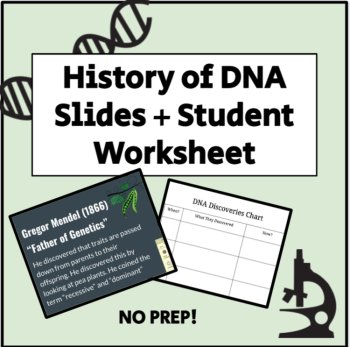
History of DNA Slides + Student Worksheet
 Ms Kiaras Science Teacher Shoppe
$4.00

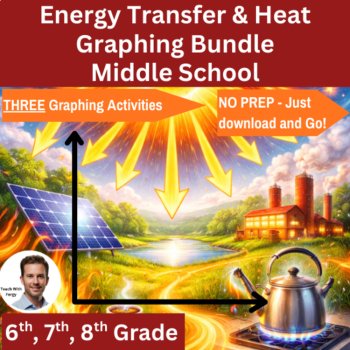
Energy Transfer and Heat Investigation Graphing Lab Bundle | 6th, 7th, 8th Grade
$5.97 $3.97
Add to cartThese three energy transfer and heat graphing investigations help students understand how thermal energy moves through matter while building strong graphing and data analysis skills. This bundle gives teachers an easy, NO PREP way to have students work with real-world style datasets to explore Heating Curves, Heat Transfer, and Heating & Cooling Processes.
There are 3 Graphing Labs Included:
Students analyze temperature and energy datasets related to heating processes, cooling processes, and heat transfer mechanisms. They then create a variety of graph types from data tables before using their graphs to identify patterns, analyze temperature trends, and explain how thermal energy moves through matter.
Each activity includes a complete answer key with the required graphs if you need to differentiate for different ability levels.
How It Works
Students use provided real-world data tables to:
Each activity moves students from:
reading data → graphing data → interpreting patterns → explaining energy transfer processes
Perfect for:
This graphing bundle is also included inside my Middle School Science Graphing & Data Analysis Mega Bundle at a significant discount. The bundle contains graphing activities for all 6th, 7th, and 8th grade science topics.
What’s Included
✅ Three energy transfer graphing investigations
✅ Real-world style thermal energy data tables for each activity
✅ Multiple graphing tasks in every investigation
✅ Data analysis discussion questions
✅ Complete answer keys
✅ Extension activities
✅ Rubrics for each investigation
Topics Students Explore
Teacher-Friendly Features
Report this resource to Linked Through Learning
Reported resources will be reviewed by our team. Report this resource to let us know if this resource breaks our rules.
No questions yet.

Meet the Seller
Middle and High School Science Engaging Resources
I have been selling resources to middle and high school teachers for the last 15 years. During that time I've also been in the classroom so I know what works and what will help your students the most.
Canada