Science Posters- The Periodic Table-Brown Corduroy Design
$5.00 (1)

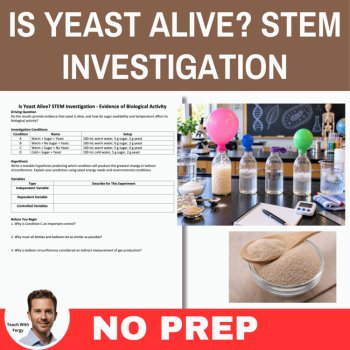
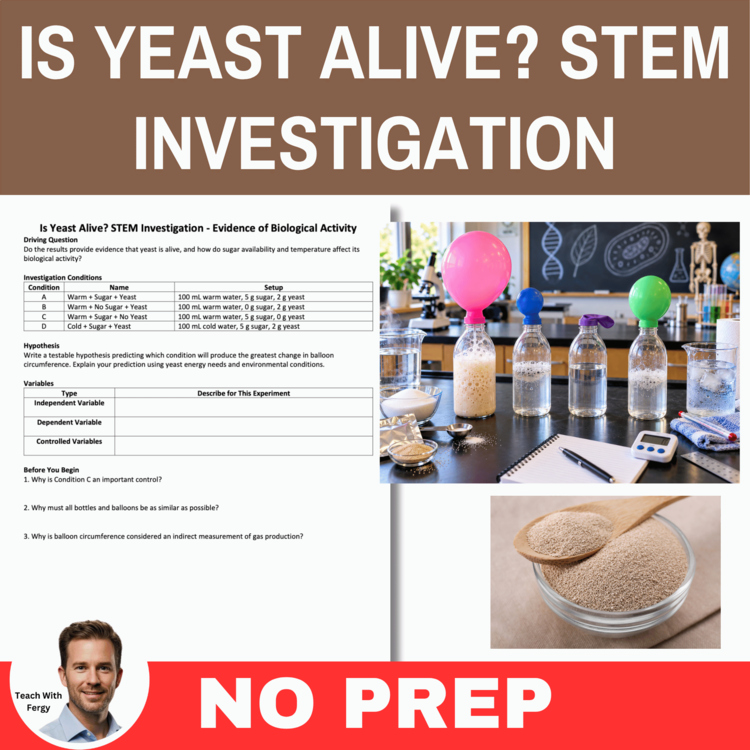
Students will investigate yeast, cellular energy use, and the characteristics of living things by comparing yeast under four different experimental conditions. Using bottles, balloons, sugar, yeast, and warm and cold water, students explore how the presence of yeast, sugar availability, and temperature affect gas production.
During the investigation, students measure changes in balloon circumference, observe bubbling and foam, and evaluate whether the results provide evidence that yeast is alive. Through controlled experimentation, quantitative data collection, graphing, analysis questions, and a structured Claim–Evidence–Reasoning (CER) response, students connect yeast metabolism, respiration, fermentation, and carbon dioxide production to the characteristics of living organisms.
Learning Targets
What’s Included
Teacher Guide
Background explanations of yeast, characteristics of life, cellular energy use, respiration, alcoholic fermentation, carbon dioxide production, sugar availability, temperature, and experimental controls. Includes safety notes, investigation conditions, implementation guidance, expected results, preparation instructions, and common classroom pitfalls with practical fixes.
Student Packet
Driving question, hypothesis prompt, variables chart, pre-lab questions, step-by-step experimental procedure, temperature record, qualitative-observation space, balloon-circumference data table, rate calculations, graphing task, analysis questions, and a guided CER response.
Four Experimental Conditions
Students compare:
These carefully planned comparisons allow students to investigate the effects of sugar availability, yeast presence, and temperature while practicing the use of experimental controls.
Data Collection & Graphing
Students measure the change in balloon circumference at 0, 5, 10, 15, and 20 minutes. They calculate an average gas-production indicator rate for each condition and create a multi-line graph of Change in Balloon Circumference vs Time.
Balloon circumference is treated accurately as an indirect indicator of gas production, rather than a direct measurement of carbon dioxide volume.
Analysis & Answer Key
Sample balloon-circumference data, completed rate calculations, a model multi-line graph, expected observations, detailed analysis-question responses, scientific explanations, common sources of error, and a complete model CER connecting yeast activity to metabolism, carbon dioxide production, sugar availability, and temperature.
Rubric
A streamlined, one-page rubric assesses understanding of the investigation, hypothesis, setup and procedure, variables and controls, data and observations, calculations and graphing, data analysis, scientific understanding, CER writing, limitations and improvements, collaboration, and safety.
What Students Will Learn
Why Teachers Love It:
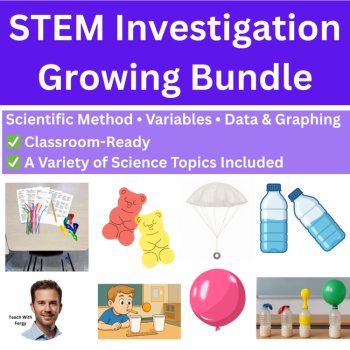
➡️ You can get this STEM as well as all my other ones in this series inside my STEM Investigations Growing Bundle. As more labs are added, the price will increase. CLICK HERE to have a look
Best For
Life Science, Biology, characteristics of living things, cells, microorganisms, cellular energy, respiration, fermentation, metabolism, experimental controls, data collection, graphing, CER writing, scientific inquiry, STEM investigations, or project-based learning.
Materials Needed
Four identical 250–500 mL plastic bottles or flasks; four identical balloons; active dry or instant yeast; granulated sugar; warm water maintained near 37°C; cold water maintained near 10°C; graduated cylinder or measuring cup; digital balance or standardized measuring spoons; flexible measuring tape or string and ruler; thermometer; timer; labels; permanent marker; funnels; trays; paper towels; student packet (included).
Non-latex balloons may be used when needed.
Estimated Timing
Before Class: Prepare warm and cold water baths → portion yeast and sugar → check balloons → organize materials
Investigation Setup: Introduce the driving question → examine the four conditions → develop a hypothesis → prepare and label the treatments
20-Minute Trial: Observe yeast activity → measure balloon circumference every five minutes → record temperatures and qualitative observations
After the Trial: Calculate indicator rates → create a multi-line graph → analyze condition comparisons → complete the CER response
Allow approximately 50–60 minutes for the complete investigation. Graphing, analysis questions, and CER writing may be completed during the same class period or assigned as a follow-up lesson.
➡️ You can get this activity inside my STEM Investigations Growing Bundle.
I also have the following STEM Labs in My Store:
NGSS Alignment
MS-LS1-7 — Develop a model to describe how food is rearranged through chemical reactions that form new molecules and release energy as matter moves through an organism.
MS-PS1-2 — Analyze and interpret data about substances before and after an interaction to determine whether a chemical reaction has occurred.
This investigation also supports the Science and Engineering Practices of planning and carrying out investigations, analyzing and interpreting data, using mathematics and computational thinking, and constructing explanations from evidence.
Assessment
Use the included one-page rubric to score understanding of the investigation, hypothesis, setup and procedure, variables and controls, data and observations, calculations and graphing, data analysis, scientific understanding, CER strength, limitations and improvements, collaboration, and safety.
Report this resource to Linked Through Learning
Reported resources will be reviewed by our team. Report this resource to let us know if this resource breaks our rules.
No questions yet.

Meet the Seller
Middle and High School Science Engaging Resources
I have been selling resources to middle and high school teachers for the last 15 years. During that time I've also been in the classroom so I know what works and what will help your students the most.
Canada
AI Assisted
I develop the ideas, plan the activities, and guide the creation of all resources. AI tools assist with writing, illustrations, and design. Every resource is reviewed, edited, and refined using my teaching experience to ensure quality, accuracy, and meaningful real-world learning.
$6.38 $7.98

AI Assisted
I develop the ideas, plan the activities, and guide the creation of all resources. AI tools assist with writing, illustrations, and design. Every resource is reviewed, edited, and refined using my teaching experience to ensure quality, accuracy, and meaningful real-world learning.
$7.60 $9.50