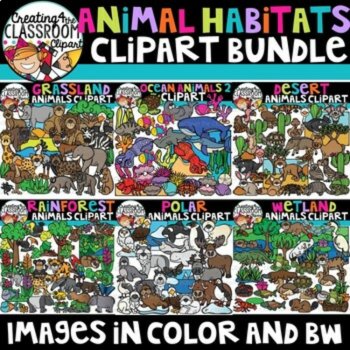
Animal Habitats Clipart MEGA Bundle – 6 Sets
$32.50 $50.00 (398)

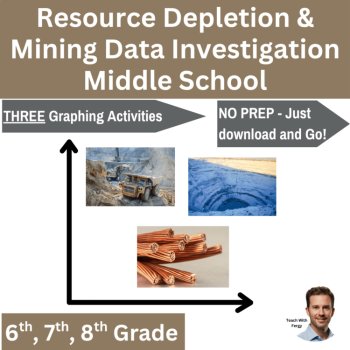
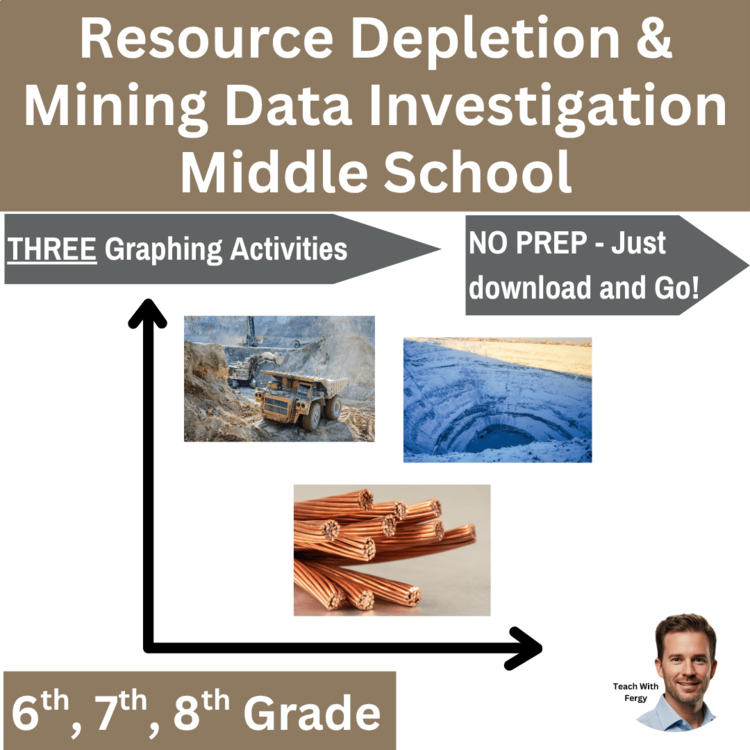
These three natural resources and resource depletion data graphing activities will help your students understand how human resource use affects availability, how consumption compares with production and new discoveries, and how growing demand for copper and lithium is connected to mining and sustainability—all while building strong graphing and data-analysis skills. This bundle gives teachers an easy, NO PREP way to have students work with real-world datasets while exploring Resource Depletion Over Time, Global Copper Demand, and Lithium Mining & Electric Vehicles.
There are 3 Graphing Labs Included:
Students analyze real-world datasets related to oil discoveries and consumption, groundwater loss during droughts, mineral reserves and production, global copper use, copper mine production, lithium consumption, electric-car sales, lithium production, and process-water demand at lithium brine locations. They then create a variety of graph types from data tables before using their graphs to identify patterns, analyze relationships, and explain how human demand affects natural resources.
Each activity includes a complete answer key with the required graphs and is very easy to differentiate for different ability levels.
Students use provided real-world data tables to:
Each activity moves students from reading data → graphing data → interpreting patterns → explaining scientific processes.
Topics Students Explore
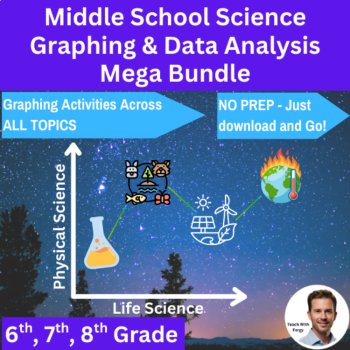
This graphing bundle is also included inside my Middle School Science Graphing & Data Analysis Mega Bundle at a significant discount. The bundle contains graphing activities for all 6th, 7th, and 8th grade science topics.
What’s Included
✅ Three natural resources and resource depletion graphing investigations
✅ Real-world style data tables for each activity
✅ Multiple graphing tasks in every investigation
✅ Data analysis discussion questions
✅ Complete answer keys
✅ Extension activities
✅ Rubrics for each investigation
Perfect for:
Teacher-Friendly Features
Report this resource to Linked Through Learning
Reported resources will be reviewed by our team. Report this resource to let us know if this resource breaks our rules.
No questions yet.

Meet the Seller
Middle and High School Science Engaging Resources
I have been selling resources to middle and high school teachers for the last 15 years. During that time I've also been in the classroom so I know what works and what will help your students the most.
Canada
$32.50 $50.00 (398)
$22.50 $34.50 (169)
$18.50 $36.50 (84)
AI Assisted
I develop the ideas, plan the activities, and guide the creation of all resources. AI tools assist with writing, illustrations, and design. Every resource is reviewed, edited, and refined using my teaching experience to ensure quality, accuracy, and meaningful real-world learning.
$7.60 $9.50