Linked Through Learning
Evaporation Race - A Water Cycle Lab Investigation | Hydrologic Cycle

Share

Description

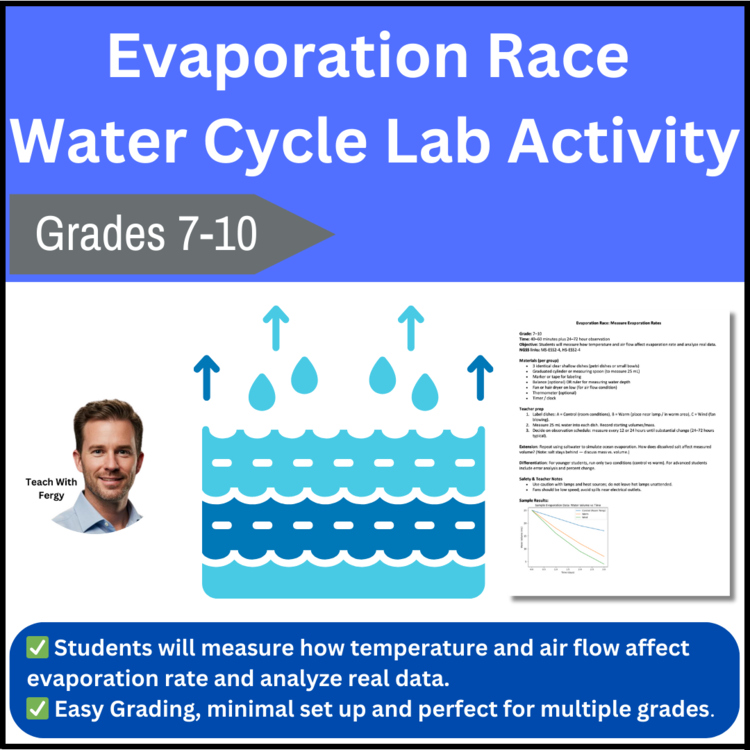
Students will investigate evaporation in the water cycle by measuring how temperature and air flow affect evaporation rate. Using identical shallow dishes filled with equal volumes of water, students set up control, warm, and wind conditions and track changes in water volume over time. Through repeated measurements, data recording, rate calculations, graphing, and evidence-based explanations, students discover how energy and moving air influence evaporation and how this process scales up to lakes, puddles, and oceans.

Learning Targets

  • Plan and carry out a controlled investigation with repeated measurements over time
  • Measure changes in water volume (or mass) to calculate evaporation rate
  • Compare evaporation rates under different environmental conditions
  • Graph water volume vs. time and interpret trends
  • Construct evidence-based explanations connecting temperature and airflow to evaporation
  • Explain evaporation’s role in the water cycle and real-world systems

What’s Included

  • Teacher Guide: Setup diagrams, safety notes for heat and fans, pacing suggestions for multi-day observations, and background on evaporation as a surface process. Includes guidance for standardizing water volume, dish type, placement, and measurement intervals to ensure fair comparisons.
  • Student Packet: Clear setup steps, variables identification, labeled data tables for 24–72 hour observations, evaporation-rate calculations (mL/day), graphing instructions, and structured analysis questions tied to real-world water cycle examples.
  • Class Data & Graphing Pages: Class data summary chart, line-graph template (“Water Volume vs Time”), labeled axes, and a comparison prompt requiring students to identify which condition evaporated fastest using numerical evidence.
  • Analysis & Answer Key: Expected trends (wind fastest, warm next, control slowest), sample calculations, explanation examples using particle motion and energy, common sources of error, and model student responses grounded in Earth science concepts.

Why Teachers Love It:

  • Simple materials with strong, visible results
  • Excellent real-world connection to weather, climate, and the water cycle
  • Builds long-term data collection and analysis skills
  • Works well as a stations lab or multi-day investigation
  • Supports CER-style reasoning without overwhelming students
  • Easy to differentiate across grade levels

Best For

Earth Science, Water Cycle units, evaporation & phase change, environmental science, data analysis over time, graphing practice, and CER writing.

Materials Needed

Clear shallow dishes (petri dishes or bowls), water, measuring device (graduated cylinder or spoon), marker or tape, ruler or balance (optional), fan or hair dryer (low setting), lamp or warm area, timer/clock, student lab sheet (included). Optional: thermometer.

Estimated Timing:

  • 40–60 minutes for setup, predictions, and initial measurements
  • 24–72 hours for observations
  • 30 minutes for calculations, graphing, and analysis question

NGSS alignment

MS-ESS2-4, HS-ESS2-4

Practices: Planning & Carrying Out Investigations; Analyzing & Interpreting Data; Using Mathematics & Computational Thinking; Constructing Explanations; Argument from Evidence

Report this resource to Linked Through Learning

Reported resources will be reviewed by our team. Report this resource to let us know if this resource breaks our rules.

Meet the Seller

Middle and High School Science Engaging Resources

I have been selling resources to middle and high school teachers for the last 15 years. During that time I've also been in the classroom so I know what works and what will help your students the most.

Canada

You May Also Like

More From This Store