
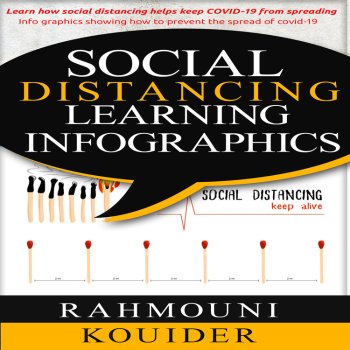
Social Distancing Learning Infographics
Free

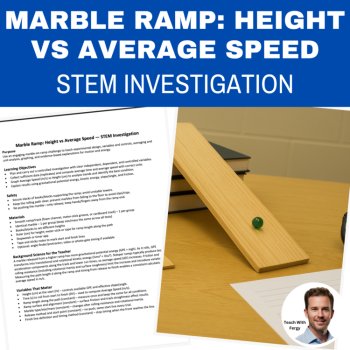
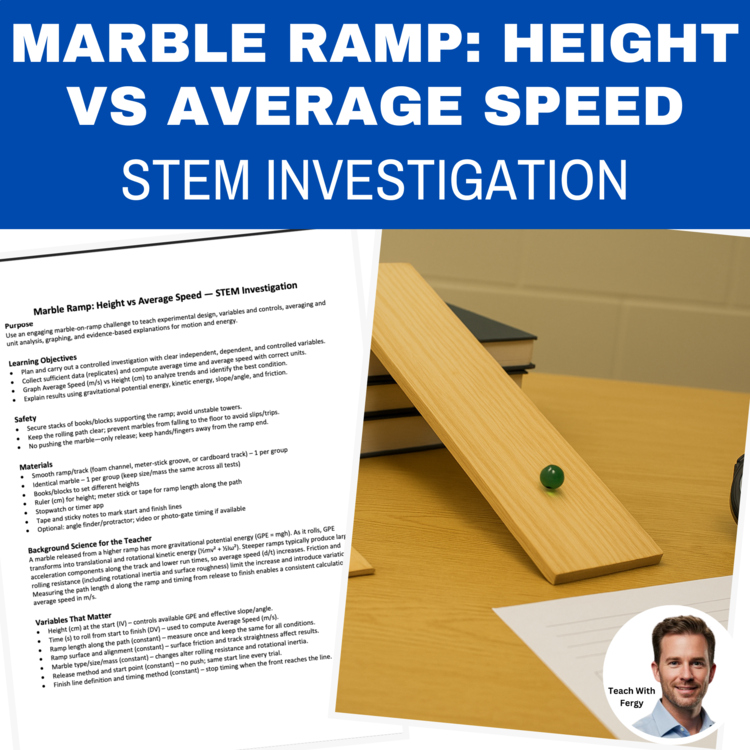
Give students a fast, hands-on motion investigation: set up a simple marble ramp, change only the ramp height, and measure how height affects average speed.
With clear test rules and simple materials, students plan a fair test, collect multiple times for each height, calculate average speed, and create a comparison graph of Average Speed vs Ramp Height.
The teacher guide explains why higher ramps provide more stored energy (gravitational potential) that turns into motion (kinetic), so you can teach the science behind the results.
What’s Included
Why Teachers Love It
Best For
Science or STEM; forces & motion, energy, scientific method, data & graphing, stations, and enrichment.
Materials Needed
Marble (or another small round object), smooth ramp/track (foam channel, meter-stick groove, or small board), stack of books/blocks (to vary height), ruler (cm), meter stick/tape (path length), stopwatch/timer, tape, sticky notes.
Estimated Timing
1 class period for five heights × repeat runs and graph; add 15–20 minutes if you want slow-motion timing, angle measurement, or a class share-out. Easily stretchable to Day 2 especially if you want to add additional trials.
➡️ You can get this STEM as well as all my other ones in this series inside my STEM Investigations Growing Bundle. As more labs are added, the price will increase. CLICK HERE to have a look
I also have the following STEM Labs in My Store:
NGSS alignment
Report this resource to Linked Through Learning
Reported resources will be reviewed by our team. Report this resource to let us know if this resource breaks our rules.
No questions yet.

Meet the Seller
Middle and High School Science Engaging Resources
I have been selling resources to middle and high school teachers for the last 15 years. During that time I've also been in the classroom so I know what works and what will help your students the most.
Canada
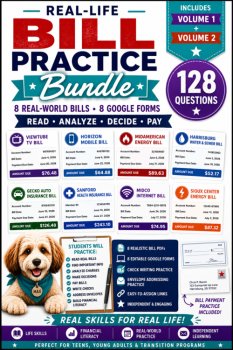
AI Assisted
I develop the ideas, plan the activities, and guide the creation of all resources. AI tools assist with writing, illustrations, and design. Every resource is reviewed, edited, and refined using my teaching experience to ensure quality, accuracy, and meaningful real-world learning.
$6.38 $7.98

AI Assisted
I develop the ideas, plan the activities, and guide the creation of all resources. AI tools assist with writing, illustrations, and design. Every resource is reviewed, edited, and refined using my teaching experience to ensure quality, accuracy, and meaningful real-world learning.
$7.60 $9.50
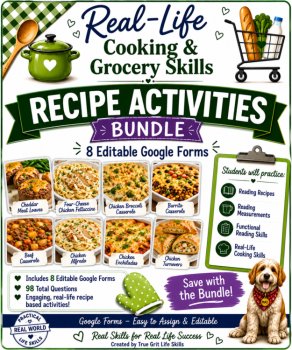
AI Assisted
I develop the ideas, plan the activities, and guide the creation of all resources. AI tools assist with writing, illustrations, and design. Every resource is reviewed, edited, and refined using my teaching experience to ensure quality, accuracy, and meaningful real-world learning.
$5.60 $7.00
AI Assisted
I develop the ideas, plan the activities, and guide the creation of all resources. AI tools assist with writing, illustrations, and design. Every resource is reviewed, edited, and refined using my teaching experience to ensure quality, accuracy, and meaningful real-world learning.
$5.60 $7.00
AI Assisted
I develop the ideas, plan the activities, and guide the creation of all resources. AI tools assist with writing, illustrations, and design. Every resource is reviewed, edited, and refined using my teaching experience to ensure quality, accuracy, and meaningful real-world learning.
$6.56 $8.20