
Linked Through Learning
Salt & Evaporation: Mass, Volume, & Salinity Changes - A Water Cycle Lab

Share

Description

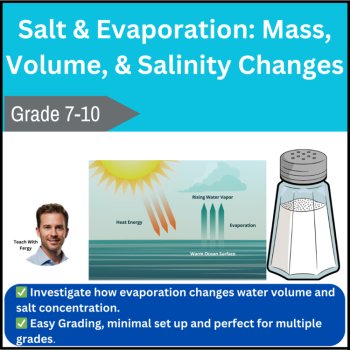
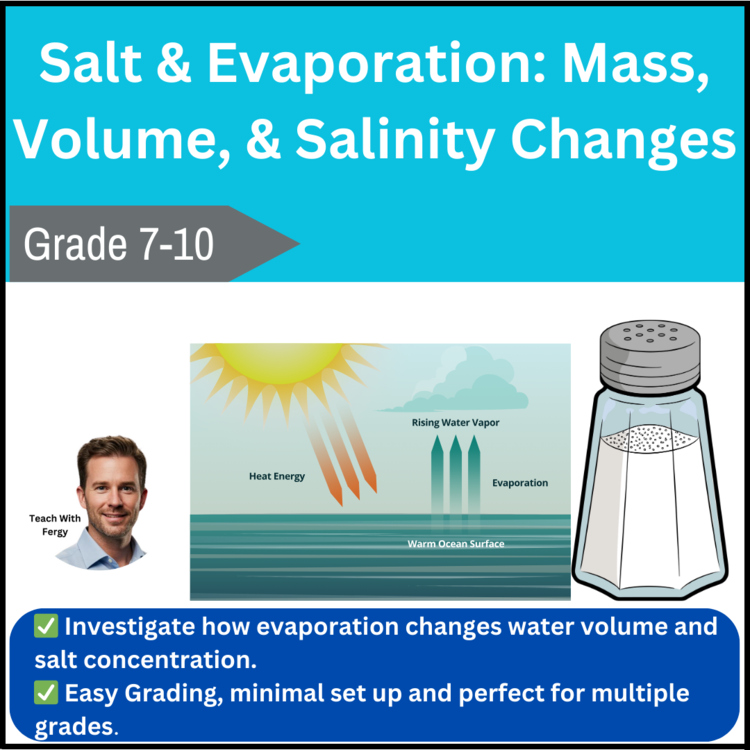
Students will investigate how evaporation changes water volume and salt concentration by comparing freshwater, ocean-like salinity, and high-salinity solutions over multiple days. Using shallow dishes, measured salt masses, and repeated mass or volume measurements, students track evaporation and calculate changing salinity. Through quantitative data collection, graphing, and real-world analysis, students connect laboratory results to ocean salinity, enclosed basins like the Dead Sea, and salt-pan formation.

Learning Targets

  • Plan and carry out a long-term quantitative investigation
  • Measure changes in water mass or volume caused by evaporation
  • Calculate salinity and evaporation-related concentration changes
  • Analyze how dissolved salt affects evaporation rate
  • Graph salinity changes over time and compare conditions
  • Construct explanations connecting evaporation to ocean and lake salinity

What’s Included

  • Teacher Guide: Step-by-step preparation instructions for freshwater, low-salinity (ocean simulation), and high-salinity (salt pan simulation) solutions. Includes safety notes, pacing guidance for multi-day observations, background on vapor pressure and evaporation, and tips for consistent measurements using balances or graduated cylinders.
  • Student Packet: Clear setup instructions, hypothesis/claim prompt, labeled data tables for up to 7 days of measurements, guided salinity calculations, graphing tasks, and structured conclusion and analysis questions tied to real-world Earth systems.
  • Class Data & Graphing Pages: Class summary chart, salinity-over-time graph template, labeled axes, and comparison prompts requiring students to identify trends using numerical evidence.
  • Analysis & Answer Key: Expected trends (salinity increases as water evaporates; higher salinity slightly slows evaporation), sample calculations, model student explanations, common sources of error, and real-world reasoning tied to oceans, salt pans, and enclosed basins.

Why Teachers Love It:

  • Strong real-world connection to oceans, climate, and salt production
  • Builds quantitative lab skills using real measurements over time
  • Excellent integration of Earth science and physical science concepts
  • Flexible setup: works as a station, long-term demo, or group lab
  • Clear visual and numerical evidence of evaporation and concentration
  • Easily extendable for advanced students

Best For

Earth science, oceanography, evaporation & salinity, water cycle units, physical science properties of matter, graphing and data analysis, and CER-based explanations.

Materials Needed

Shallow dishes, table salt (NaCl), distilled or tap water, digital balance or graduated cylinders, pipettes, labels, marker, tray, student lab sheet (included). Optional: thermometer, fan, lamp, hot plate (teacher-supervised only).

Estimated Timing:

  • 60–90 minutes for setup and initial measurements
  • 3–7 days of observation and data collection
  • 30–45 minutes for calculations, graphing, and analysis

NGSS alignment

MS-ESS2-4, HS-ESS2-5, HS-PS1-3
Practices: Planning & Carrying Out Investigations; Analyzing & Interpreting Data; Using Mathematics & Computational Thinking; Constructing Explanations; Developing & Using Models; Argument from Evidence

Report this resource to Linked Through Learning

Reported resources will be reviewed by our team. Report this resource to let us know if this resource breaks our rules.

Meet the Seller

Middle and High School Science Engaging Resources

I have been selling resources to middle and high school teachers for the last 15 years. During that time I've also been in the classroom so I know what works and what will help your students the most.

Canada

You May Also Like

More From This Store