
Cute Animal Doodles Kindness Coloring Bookmarks Compliment Craft Cards Rewards

$2.35 (6)

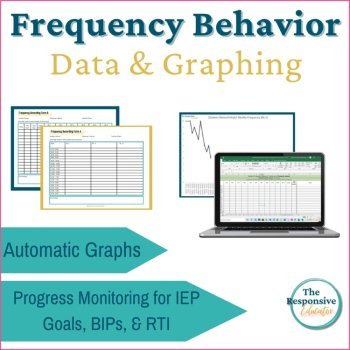
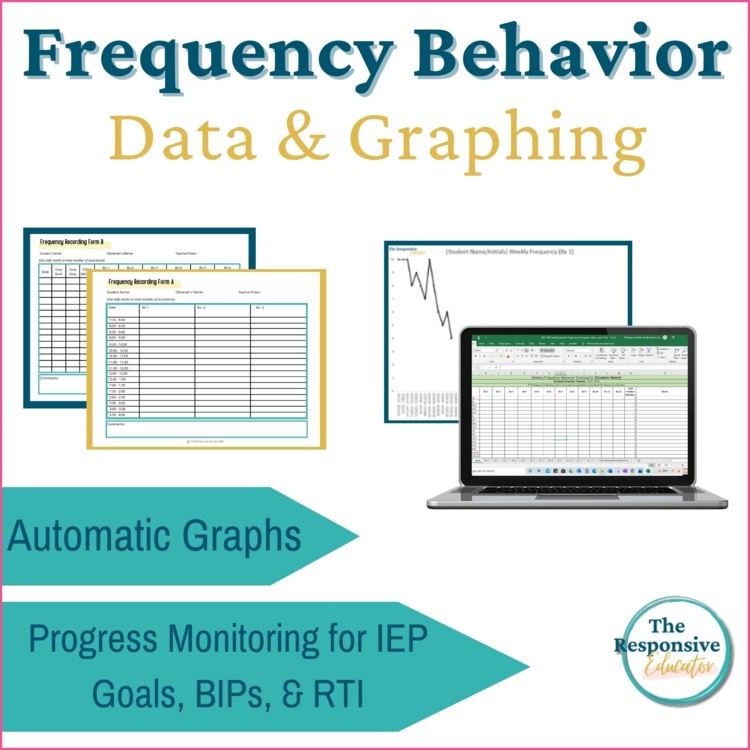
Frequency Behavior Data Sheet Student Data Tracking Graph Documentation Form
(2 ratings)$6.00
Add to cartFrequency Behavior Data Sheet & Student Data Tracking Graph: Simple, Reliable Behavior Frequency Data
Tracking student behavior is essential—but collecting accurate, usable frequency data can quickly feel overwhelming. Teachers are often expected to count behaviors, monitor progress, and show trends over time while juggling instruction, interventions, and documentation.
Frequency Behavior Data Sheet & Student Data Tracking Graph was created to simplify that process. This tool gives you a clear, efficient way to record behavior occurrences, visualize patterns, and make data-driven decisions without overcomplicating behavior tracking.
Instead of scattered notes or inconsistent counts, this resource helps you collect clean frequency data you can confidently use for RTI, IEP goals, and behavior plans.
Why Frequency Data Matters
Frequency data is most effective for behaviors that:
Examples include calling out, leaving a seat, task refusal, or peer interactions.
When collected consistently, frequency data helps teams:
This tool is designed for situations where how often a behavior occurs is the most meaningful data point.
What This Tool Helps You Do
This resource supports educators by helping them:
What’s Included
How to Use the Frequency Behavior Data Sheet
Using Phase Lines to Strengthen Your Data
Phase lines allow you to mark major changes that may impact behavior, such as:
Phase lines make it easier to interpret behavior changes and are especially helpful when monitoring BIPs. Instructions for adding phase lines are included.
Important Note:
This resource works in Excel and Google Sheets. However, phase lines can only be added in Excel, as this feature is not supported in Google Sheets.
Is Frequency Tracking the Right Choice?
Frequency tracking works best when behaviors can be counted accurately.
Bottom Line
If you need a practical, efficient way to count behaviors and show progress over time, Frequency Behavior Data Sheet & Student Data Tracking Graph gives you a clear system for collecting and analyzing frequency data—without unnecessary complexity.
Looking for More Behavior Tracking Tools?
If you like this resource, you might also be interested in:
Learn More: Blog Posts to Learn More About Behavior Data & Measurement
Connect with Me!
Please follow me on TPT for more exceptional data collection and SEL resources. And remember, your feedback matters! If you decide to make a purchase, kindly leave a review, and TPT will reward you with credits to explore more fabulous resources. Together, let's create a positive and data-informed learning environment for our students.
Report this resource to Linked Through Learning
Reported resources will be reviewed by our team. Report this resource to let us know if this resource breaks our rules.
“Thank you so much for providing just what I needed to track behaviors in my special education classroom. It is perfect!”
“This has been so helpful with my behaviors this year!”
5.0
2
ratings
Thank you so much for providing just what I needed to track behaviors in my special education classroom. It is perfect!
Reply from The Responsive Educator
Thanks so much for your review, Amy! I hope you have a relaxing summer and a great year next year!
Amy A.
Grades taught: 1st, 2nd, K
This has been so helpful with my behaviors this year!
Reply from The Responsive Educator
Thanks so much for your review!
Ashley R.
No questions yet.

Meet the Seller
Behavior Support and Interventions
I provide resources that help teachers manage classroom behavior and teach social-emotional skills effectively. With over 20 years of experience in special education, I offer practical tools and strategies to support both teachers and students in achieving their best. I have been dedicated to supporting students with special needs since 2005, specializing in both behavioral and academic interventions. My extensive experience spans teaching in self-contained classrooms from grades K-12 and assisting general and special education teachers with managing significant behavioral challenges. As a former lead of an RTI committee and a behavior specialist, I have a deep understanding of effective classroom management strategies.
Florida