Social Distancing Learning Infographics

Free

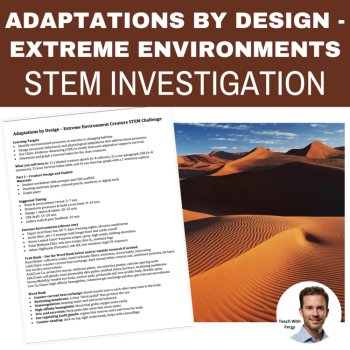
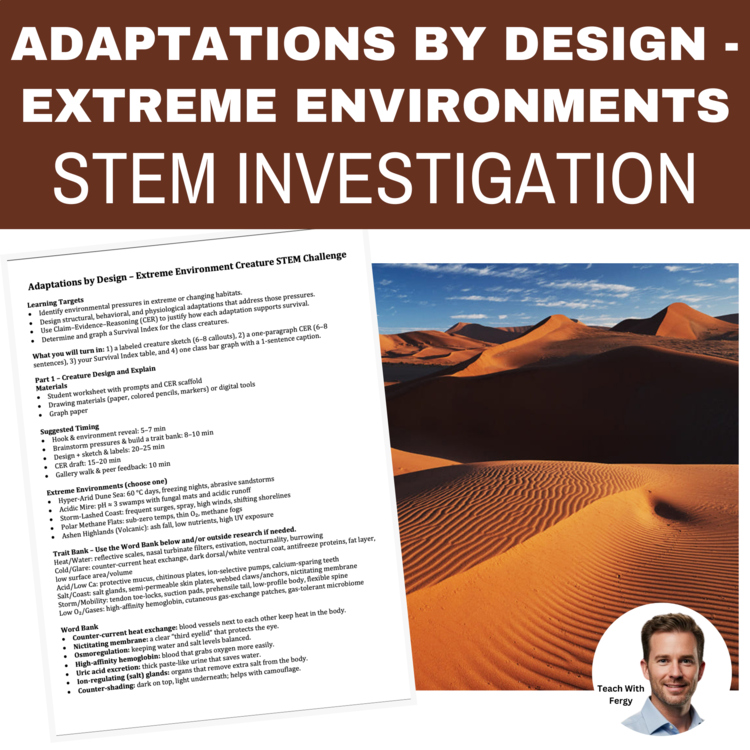
Students will design a biologically plausible organism, choose one extreme environment, and justify how its adaptations solve real environmental pressures. With a trait bank, word bank, a structured CER, and a Survival Index that rolls into a class bar graph, students connect structure → function → survival while practicing clear scientific communication.
Learning Targets
Identify environment pressures; design structural, behavioral, and physiological adaptations; write a CER; compute and graph a Survival Index.
What’s Included
Why Teachers Love It
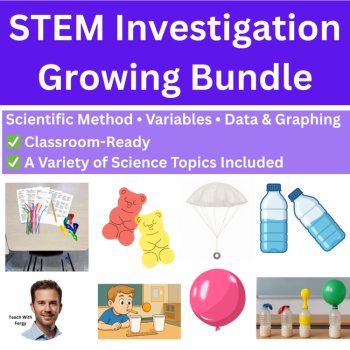
➡️ You can get this STEM as well as all my other ones in this series inside my STEM Investigations Growing Bundle. As more labs are added, the price will increase. CLICK HERE to have a look
Best For
Life Science (adaptations, structure & function), intro to natural selection/survival, scientific practices, data & graphing, stations, enrichment, or sub plans.
Materials Needed
Student worksheet (included), drawing supplies or digital sketch tools, graph paper (or template). That’s it—no lab setup required.
Estimated Timing:
1 class period for choose environment → sketch & label → Survival Index; add 15–30 minutes for CER, class graph, and a gallery walk/peer feedback (timing guidance provided).
➡️ You can get this activity inside my STEM Investigations Growing Bundle.
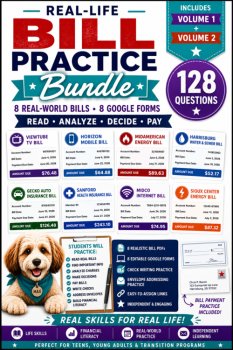
I also have the following STEM Labs in My Store:
NGSS alignment
Assessment
Use the included rubric to score environment understanding, adaptation quality and plausibility, scientific accuracy, CER strength, and class data/graph work.
Report this resource to Linked Through Learning
Reported resources will be reviewed by our team. Report this resource to let us know if this resource breaks our rules.
No questions yet.

Meet the Seller
Middle and High School Science Engaging Resources
I have been selling resources to middle and high school teachers for the last 15 years. During that time I've also been in the classroom so I know what works and what will help your students the most.
Canada
AI Assisted
I develop the ideas, plan the activities, and guide the creation of all resources. AI tools assist with writing, illustrations, and design. Every resource is reviewed, edited, and refined using my teaching experience to ensure quality, accuracy, and meaningful real-world learning.
$6.38 $7.98

AI Assisted
I develop the ideas, plan the activities, and guide the creation of all resources. AI tools assist with writing, illustrations, and design. Every resource is reviewed, edited, and refined using my teaching experience to ensure quality, accuracy, and meaningful real-world learning.
$7.60 $9.50
AI Assisted
I develop the ideas, plan the activities, and guide the creation of all resources. AI tools assist with writing, illustrations, and design. Every resource is reviewed, edited, and refined using my teaching experience to ensure quality, accuracy, and meaningful real-world learning.
$5.60 $7.00
AI Assisted
I develop the ideas, plan the activities, and guide the creation of all resources. AI tools assist with writing, illustrations, and design. Every resource is reviewed, edited, and refined using my teaching experience to ensure quality, accuracy, and meaningful real-world learning.
$5.60 $7.00
AI Assisted
I develop the ideas, plan the activities, and guide the creation of all resources. AI tools assist with writing, illustrations, and design. Every resource is reviewed, edited, and refined using my teaching experience to ensure quality, accuracy, and meaningful real-world learning.
$6.56 $8.20