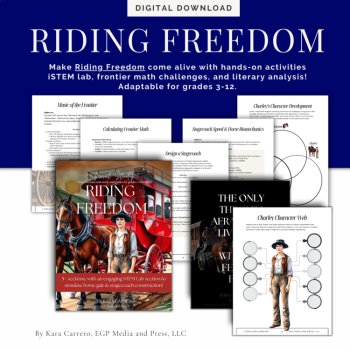
Riding Freedom Novel Study – A Cross-Curricular Journey

$12.00

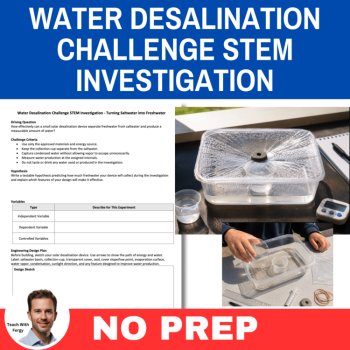
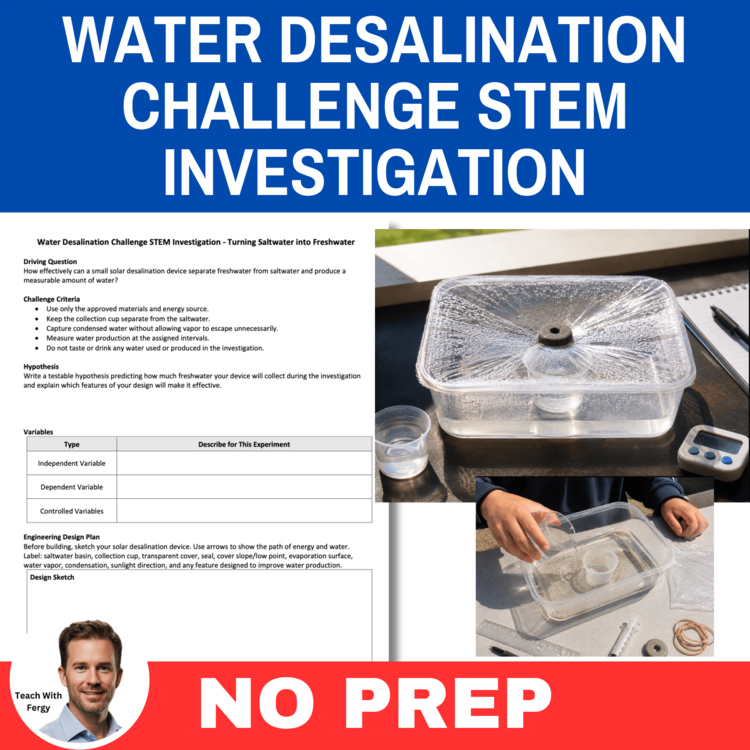
Students will investigate water desalination, phase changes, and sustainable freshwater production by designing and building their own solar desalination device. Using a shallow basin, prepared saltwater, collection cup, transparent cover, and solar energy, students explore how evaporation and condensation can separate water from dissolved salt.
During a five-hour investigation, students measure freshwater production, observe condensation and droplet movement, graph cumulative water collection, and evaluate how effectively their solar desalination device performs. Through engineering design, quantitative data collection, graphing, analysis questions, and a structured Claim–Evidence–Reasoning (CER) response, students connect the water cycle and phase changes to real-world water sustainability and engineering.
Learning Targets
What’s Included
Teacher Guide
Background explanations of desalination, solar stills, evaporation, condensation, salt separation, solar energy, and sustainable water production. Includes safety notes, challenge constraints, implementation guidance, expected results, and common classroom pitfalls with practical fixes.
Student Packet
Driving question, hypothesis prompt, variables chart, engineering design plan, step-by-step device-building instructions, freshwater-production data table, observation prompts, calculations, graphing task, analysis questions, and a guided CER response.
Data Collection & Graphing
Students measure cumulative freshwater collection and water produced during each interval. They create a line graph of Cumulative Freshwater Collected vs Time and analyze patterns in water production and device performance.
Analysis & Answer Key
Sample freshwater-production data, a completed line graph, expected patterns, detailed analysis-question responses, scientific explanations, common sources of error, and a complete model CER connecting solar energy, evaporation, condensation, salt separation, and design efficiency.
Rubric
Assesses understanding of the challenge, hypothesis, engineering design, variables and controls, procedure, data collection, observations, graphing, data analysis, scientific understanding, CER writing, and design improvements.
What Students Will Learn
Why Teachers Love It:
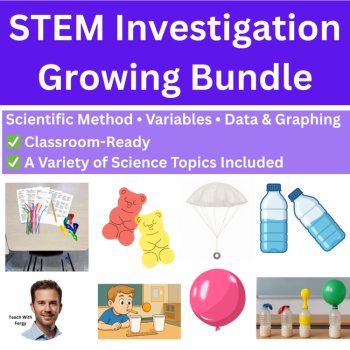
➡️ You can get this STEM as well as all my other ones in this series inside my STEM Investigations Growing Bundle. As more labs are added, the price will increase. CLICK HERE to have a look
Best For
Physical Science, Earth Science, Environmental Science, the water cycle, phase changes, desalination, renewable energy, sustainability, engineering design, data collection, graphing, CER writing, STEM challenges, or project-based learning.
Materials Needed
Shallow basin, tray, bowl, or wide recycled container; small collection cup; clear plastic wrap or another transparent cover; rubber bands, tape, or clips; small pebble, washer, or other safe weight; prepared saltwater; graduated cylinder, syringe, or small measuring cup; timer or clock; permanent marker; ruler; student packet (included).
Estimated Timing
Day 1: Design → build → setup → initial measurements
Hours 1–5: Observe condensation → measure collected water → record data and observations
Day 2 or After Collection: Final measurements → graphing → analysis questions → CER writing → design evaluation
Allow approximately 45–60 minutes for designing and building, followed by a 4–6 hour exposure period with brief scheduled measurement intervals. Additional time is needed for graphing, analysis questions, CER writing, and design evaluation.
➡️ You can get this activity inside my STEM Investigations Growing Bundle.
I also have the following STEM Labs in My Store:
NGSS Alignment
MS-PS1-4 — Develop a model that predicts and describes changes in particle motion, temperature, and state when thermal energy is added or removed.
MS-ESS2-4 — Develop a model describing how water cycles through Earth’s systems through processes driven by solar energy and gravity.
MS-ETS1-1, MS-ETS1-3 — Define the criteria and constraints of a design problem and analyze test data to determine the effectiveness of engineering solutions.
Assessment
Use the included rubric to score understanding of the challenge, hypothesis, engineering design, variables and controls, procedure, data collection, observations, graphing, data analysis, scientific understanding, CER strength, and design improvements.
Report this resource to Linked Through Learning
Reported resources will be reviewed by our team. Report this resource to let us know if this resource breaks our rules.
No questions yet.

Meet the Seller
Middle and High School Science Engaging Resources
I have been selling resources to middle and high school teachers for the last 15 years. During that time I've also been in the classroom so I know what works and what will help your students the most.
Canada
AI Assisted
I develop the ideas, plan the activities, and guide the creation of all resources. AI tools assist with writing, illustrations, and design. Every resource is reviewed, edited, and refined using my teaching experience to ensure quality, accuracy, and meaningful real-world learning.
$6.38 $7.98

AI Assisted
I develop the ideas, plan the activities, and guide the creation of all resources. AI tools assist with writing, illustrations, and design. Every resource is reviewed, edited, and refined using my teaching experience to ensure quality, accuracy, and meaningful real-world learning.
$7.60 $9.50

AI Assisted
I develop the ideas, plan the activities, and guide the creation of all resources. AI tools assist with writing, illustrations, and design. Every resource is reviewed, edited, and refined using my teaching experience to ensure quality, accuracy, and meaningful real-world learning.
$5.60 $7.00
AI Assisted
I develop the ideas, plan the activities, and guide the creation of all resources. AI tools assist with writing, illustrations, and design. Every resource is reviewed, edited, and refined using my teaching experience to ensure quality, accuracy, and meaningful real-world learning.
$5.60 $7.00
AI Assisted
I develop the ideas, plan the activities, and guide the creation of all resources. AI tools assist with writing, illustrations, and design. Every resource is reviewed, edited, and refined using my teaching experience to ensure quality, accuracy, and meaningful real-world learning.
$6.56 $8.20
AI Assisted
I develop the ideas, plan the activities, and guide the creation of all resources. AI tools assist with writing, illustrations, and design. Every resource is reviewed, edited, and refined using my teaching experience to ensure quality, accuracy, and meaningful real-world learning.
$7.60 $9.50