Linked Through Learning

Middle School Graphing Resources

Clear all filters

Filters

Loading filters…

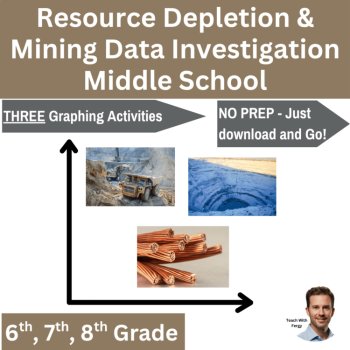
Resource Depletion & Mining Data Graphing Lab Bundle 6th, 7th, 8th Grade

Created by
TWFScience

These three natural resources and resource depletion data graphing activities will help your students understand how human resource use affects availability, how consumption compares with production and new discoveries, and how growing demand for copper and lithium is connected to mining and sustain

6th - 9th Graphing, Earth Sciences, Physical Science

NGSS MS-ESS3-1, MS-ESS3-3, MS-ESS3-4

Also included in: Middle School Science Graphing & Data Analysis Bundle | Real-World Data 6, 7, 8

$5.97

$3.97
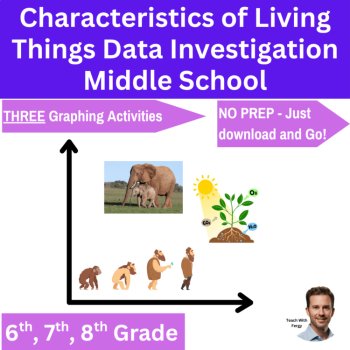
Characteristics of Living Things Data Graphing Lab Bundle 6th, 7th, 8th Grade

Created by
TWFScience

These three characteristics of living things data graphing activities will help your students understand how organisms grow and develop, obtain and use energy, respond to environmental changes, and maintain stable internal conditions—all while building strong graphing and data-analysis skills. This

6th - 9th Graphing, Biology, General Science

NGSS MS-LS2-1, MS-LS2-2, MS-LS2-4+3

Also included in: Characteristics of Living Things Lesson Bundle | What is Life, Living, Nonliving

$5.97

$3.97

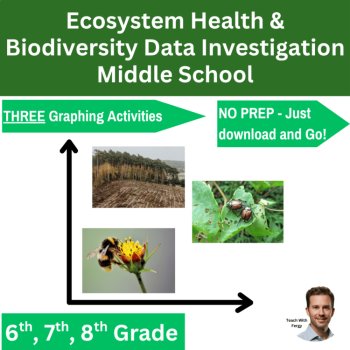
Ecosystem Health & Biodiversity Data Graphing Lab Bundle 6th, 7th, 8th Grade

Created by
TWFScience

These three ecosystem health and biodiversity data graphing activities will help your students understand how habitat loss, invasive species, environmental conditions, and pollinator changes affect populations, biodiversity, ecosystem services, and ecosystem balance—all while building strong graphin

6th - 9th Graphing, Biology, Environment

NGSS MS-LS2-1, MS-LS2-2, MS-LS2-4+3

Also included in: Middle School Science Graphing & Data Analysis Bundle | Real-World Data 6, 7, 8

$5.97

$3.97
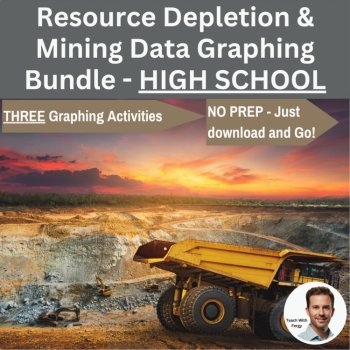
Resource Depletion & Mining Data Analysis Graphing Bundle | HIGH SCHOOL

Created by
TWFScience

These three natural resources and resource depletion data graphing activities will help your students understand how human resource use affects availability, how consumption compares with production and new discoveries, and how growing demand for copper and lithium is connected to mining and sustain

6th - 9th Graphing, Earth Sciences, Physical Science

NGSS MS-ESS3-1, MS-ESS3-3, MS-ESS3-4

Also included in: High School Science Graphing and Data Analysis Mega Bundle | Real-World Data Lab

$5.97

$3.97