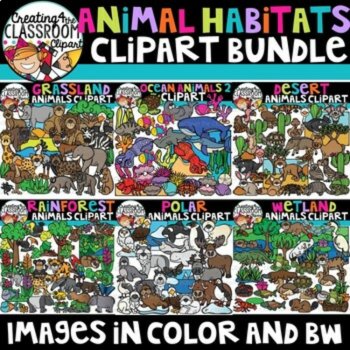
Animal Habitats Clipart MEGA Bundle – 6 Sets

$32.50 $50.00 (398)

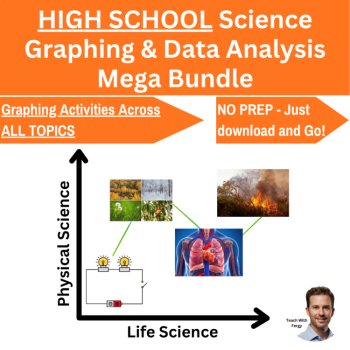
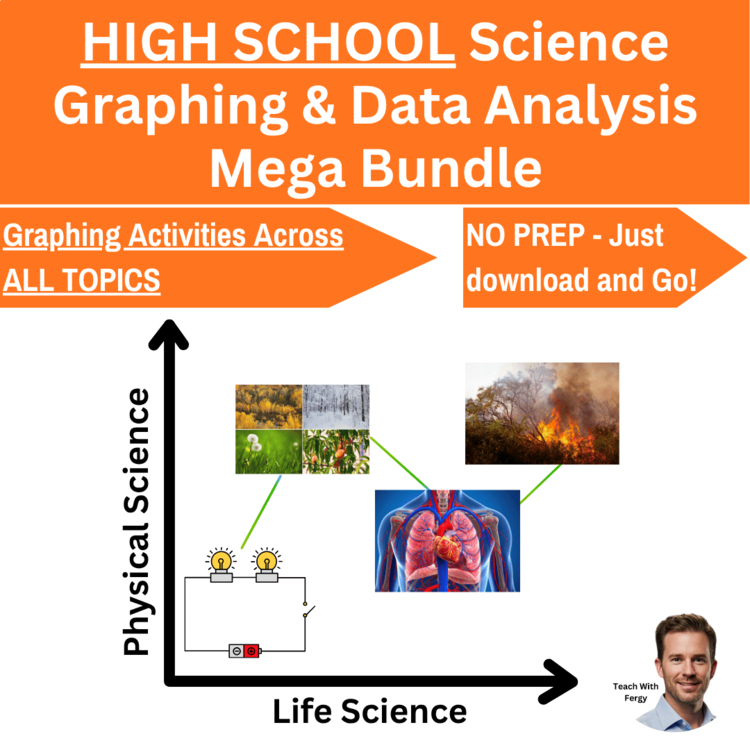
High School Science Graphing and Data Analysis Mega Bundle | Real-World Data Lab
$95.52 $17.30
Get BundleThis growing bundle of science data graphing investigations helps students explore major HIGH SCHOOL science concepts while building strong graphing and data analysis skills. Each investigation uses real-world or real-world style datasets so students can analyze patterns, identify trends, and explain scientific phenomena using evidence from graphs.
This bundle gives teachers an easy, NO PREP way to incorporate meaningful data analysis into science lessons while strengthening students’ ability to interpret graphs and explain scientific relationships.
My Promise to You
I know every classroom is different. If you purchase a resource and feel it is not the right fit for your students, contact me and I’ll provide 2x the amount you paid in store credit toward another resource in my store, so you can find something that better supports your students.
Students work with data related to Earth science, environmental science, life science, and physical science topics while creating and analyzing a variety of graph types.
This GROWING mega bundle currently includes 16 investigation bundles EACH contains THREE individual investigation activities:
Additional investigation bundles will be added over time, making this a growing resource.
How It Works
Students use provided real-world or real-world style datasets to:
Each investigation guides students through:
Reading data → Graphing data → Interpreting patterns → Explaining scientific concepts
What’s Included
✅ Many individual science investigations covering major middle school science topics
✅ Real-world and real-world style datasets
✅ Multiple graphing tasks in every investigation
✅ Data analysis discussion questions
✅ Complete answer keys
✅ Extension activities
✅ Grading rubrics for each investigation
✅ BONUS Activities
Topics Students Explore
Perfect for
Teacher-Friendly Features
Report this resource to Linked Through Learning
Reported resources will be reviewed by our team. Report this resource to let us know if this resource breaks our rules.
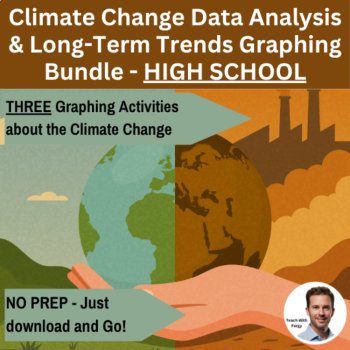
These three climate change and long-term weather data graphing activities that will help your students understand climate change while building graphing and data analysis skills. This bundle gives teachers an easy, NO PREP way to have students work with real-world environmental data to explore how E
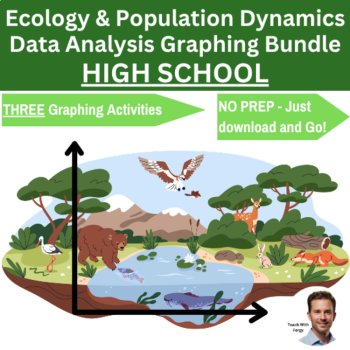
These three ecosystems and population dynamics data graphing activities will help your students understand how energy flows through ecosystems, how populations change over time, and how human activities impact biodiversity while building strong graphing and data analysis skills. This bundle gives te
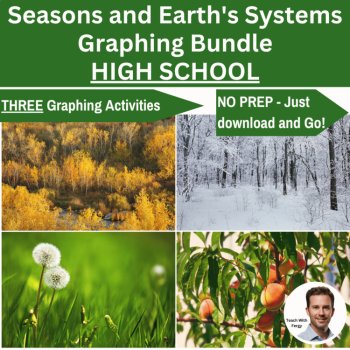
These three seasonal data and graphing activities will help your students understand seasonal changes while building graphing and data analysis skills. This bundle gives teachers an easy, NO PREP way to have students work with real-world environmental data to explore how seasons affect Earth’s syste
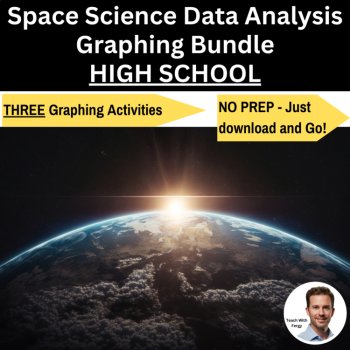
These three space science data graphing activities will help your students understand how planet size, distance, speed, and orbital period are related, how moon phases affect illumination and tides, and how temperature and brightness are connected in stars while building strong graphing and data ana
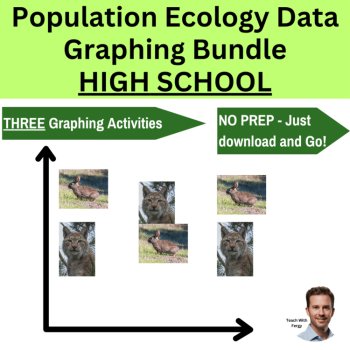
These three population ecology data graphing activities will help your students understand how predator and prey populations change over time, how resources affect carrying capacity, and how limiting factors such as food availability and disturbance affect population size while building strong graph
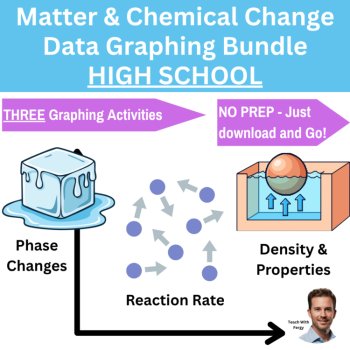
These three matter and chemical change data graphing activities will help your students understand how energy affects phase changes, how reaction rates change under different conditions, and how density relates to mass, volume, and temperature while building strong graphing and data analysis skills.
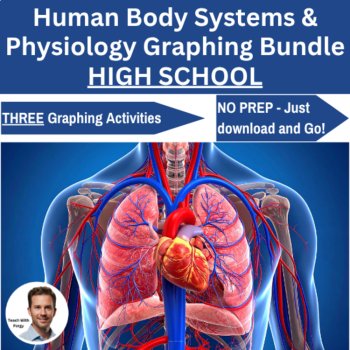
These three human body systems data graphing activities will help your students understand how heart rate changes during exercise, how breathing rate and oxygen use increase with activity, and how food energy and activity level are connected while building strong graphing and data analysis skills. T
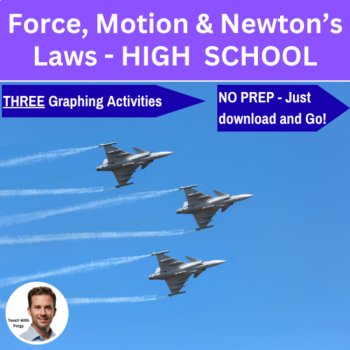
These three forces and motion data graphing activities will help your students understand how force, acceleration, friction, and motion relationships work while building strong graphing and data analysis skills. This bundle gives teachers an easy, NO PREP way to have students work with real-world st
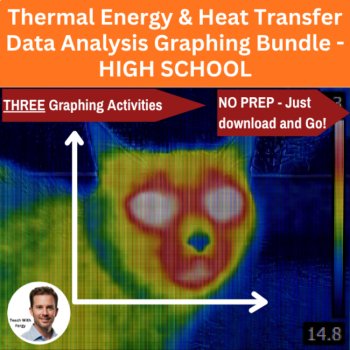
These three energy transfer and heat graphing investigations help students understand how thermal energy moves through matter while building strong graphing and data analysis skills. This bundle gives teachers an easy, NO PREP way to have students work with real-world style datasets to explore Heati
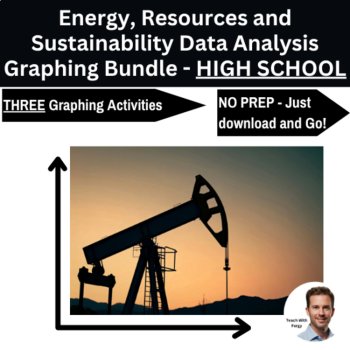
These three energy and resource use data graphing activities will help your students understand how energy production, carbon emissions, and resource extraction impact the environment while building strong graphing and data analysis skills. This bundle gives teachers an easy, NO PREP way to have stu
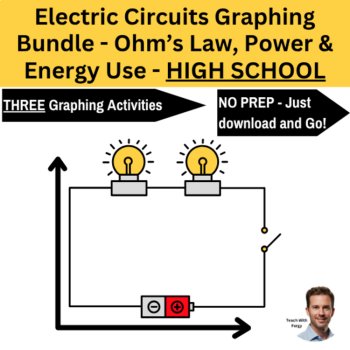
These three electricity and circuits data graphing activities will help your students understand how voltage, current, resistance, and power are related, how series and parallel circuits behave differently, and how electricity use connects to energy consumption while building strong graphing and dat
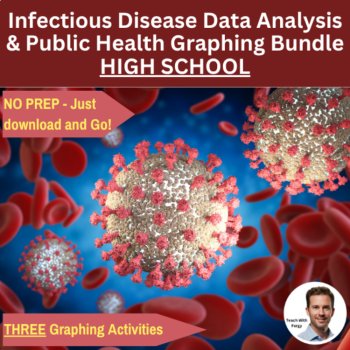
These three disease spread and public health data graphing activities will help your students understand how infectious diseases spread and how prevention strategies impact public health while building strong graphing and data analysis skills. This bundle gives teachers an easy, NO PREP way to have
These three spring environmental change data graphing activities will help your students understand how seasonal climate conditions influence ecosystems while building strong graphing and data analysis skills. This bundle gives teachers an easy, NO PREP way to have students work with real-world envi
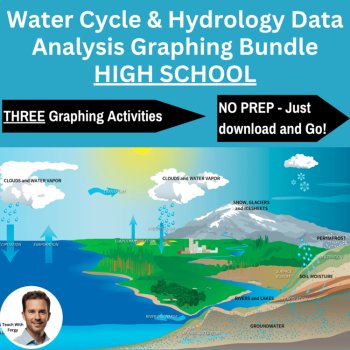
These three water cycle data graphing activities will help your students understand how precipitation varies by season and location, how temperature affects evaporation, condensation, and cloud formation, and how rainfall, soil type, and infiltration affect runoff and river flow while building stron
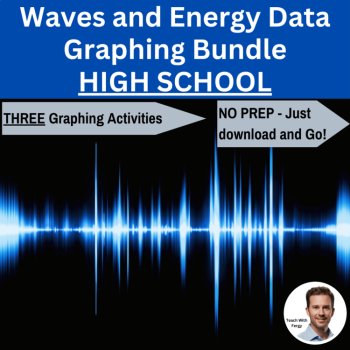
These three waves and energy data graphing activities will help your students understand how wave properties are related, how amplitude and frequency affect sound, and how wavelength, frequency, and energy are connected across the electromagnetic spectrum while building strong graphing and data anal
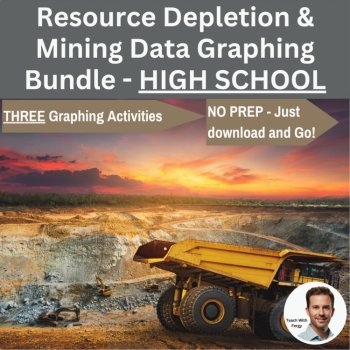
These three natural resources and resource depletion data graphing activities will help your students understand how human resource use affects availability, how consumption compares with production and new discoveries, and how growing demand for copper and lithium is connected to mining and sustain
No questions yet.

Meet the Seller
Middle and High School Science Engaging Resources
I have been selling resources to middle and high school teachers for the last 15 years. During that time I've also been in the classroom so I know what works and what will help your students the most.
Canada
$32.50 $50.00 (398)
$22.50 $34.50 (169)
$18.50 $36.50 (84)