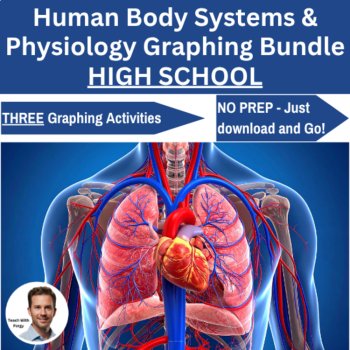
Human Body Systems & Physiology Data Graphing Lab Bundle | HIGH SCHOOL
 Created by
TWFScience
These three human body systems data graphing activities will help your students understand how heart rate changes during exercise, how breathing rate and oxygen use increase with activity, and how food energy and activity level are connected while building strong graphing and data analysis skills. T
9th - 12th Graphing, Biology, General Science
NGSS HS-LS1-2, HS-LS1-3, HS-LS1-7
Also included in: High School Science Graphing and Data Analysis Mega Bundle | Real-World Data Lab
$5.97
$3.97