Linked Through Learning

Clear all filters

Filters

Loading filters…

Space Science Data Analysis Graphing Bundle | HIGH SCHOOL | Stars, Distances

Created by
TWFScience

These three space science data graphing activities will help your students understand how planet size, distance, speed, and orbital period are related, how moon phases affect illumination and tides, and how temperature and brightness are connected in stars while building strong graphing and data ana

9th - 12th Graphing, Astronomy, Physical Science

Also included in: High School Science Graphing and Data Analysis Mega Bundle | Real-World Data Lab

$5.97

$3.97
Spring Environmental Data Analysis Graphing Bundle | HIGH SCHOOL | Seasons

Created by
TWFScience

These three spring environmental change data graphing activities will help your students understand how seasonal climate conditions influence ecosystems while building strong graphing and data analysis skills. This bundle gives teachers an easy, NO PREP way to have students work with real-world envi

9th - 12th Graphing, Biology, General Science

Also included in: High School Science Graphing and Data Analysis Mega Bundle | Real-World Data Lab

$5.97

$4.97

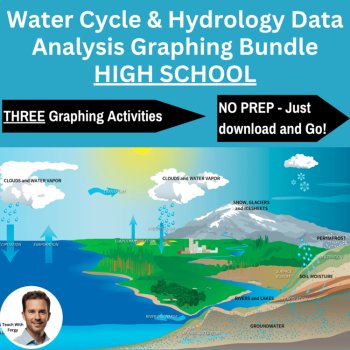
Water Cycle & Hydrology Data Analysis Graphing Bundle | HIGH SCHOOL

Created by
TWFScience

These three water cycle data graphing activities will help your students understand how precipitation varies by season and location, how temperature affects evaporation, condensation, and cloud formation, and how rainfall, soil type, and infiltration affect runoff and river flow while building stron

6th - 9th Graphing, Earth Sciences, Environment

NGSS HS-ESS3-1, HS-ESS3-3, HS-ESS3-4+1

Also included in: High School Science Graphing and Data Analysis Mega Bundle | Real-World Data Lab

$5.97

$3.97
Waves and Energy Data Graphing Lab Bundle 6th, 7th, 8th Grade | Sound and Light

Created by
TWFScience

These three waves and energy data graphing activities will help your students understand how wave properties are related, how amplitude and frequency affect sound, and how wavelength, frequency, and energy are connected across the electromagnetic spectrum while building strong graphing and data anal

6th - 9th Graphing, Physical Science, Physics

NGSS MS-PS4-1, MS-PS4-2, MS-PS4-3

Also included in: Middle School Science Graphing & Data Analysis Bundle | Real-World Data 6, 7, 8

$5.97

$3.97

Resource Depletion & Mining Data Graphing Lab Bundle 6th, 7th, 8th Grade

Created by
TWFScience

These three natural resources and resource depletion data graphing activities will help your students understand how human resource use affects availability, how consumption compares with production and new discoveries, and how growing demand for copper and lithium is connected to mining and sustain

6th - 9th Graphing, Earth Sciences, Physical Science

NGSS MS-ESS3-1, MS-ESS3-3, MS-ESS3-4

Also included in: Middle School Science Graphing & Data Analysis Bundle | Real-World Data 6, 7, 8

$5.97

$3.97

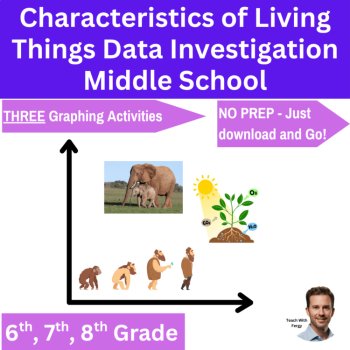
Characteristics of Living Things Data Graphing Lab Bundle 6th, 7th, 8th Grade

Created by
TWFScience

These three characteristics of living things data graphing activities will help your students understand how organisms grow and develop, obtain and use energy, respond to environmental changes, and maintain stable internal conditions—all while building strong graphing and data-analysis skills. This

6th - 9th Graphing, Biology, General Science

NGSS MS-LS2-1, MS-LS2-2, MS-LS2-4+3

Also included in: Characteristics of Living Things Lesson Bundle | What is Life, Living, Nonliving

$5.97

$3.97

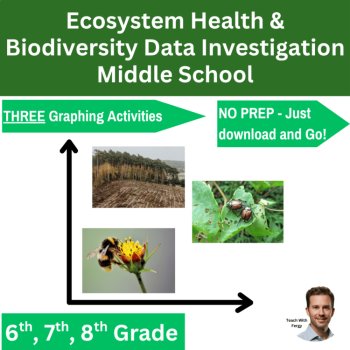
Ecosystem Health & Biodiversity Data Graphing Lab Bundle 6th, 7th, 8th Grade

Created by
TWFScience

These three ecosystem health and biodiversity data graphing activities will help your students understand how habitat loss, invasive species, environmental conditions, and pollinator changes affect populations, biodiversity, ecosystem services, and ecosystem balance—all while building strong graphin

6th - 9th Graphing, Biology, Environment

NGSS MS-LS2-1, MS-LS2-2, MS-LS2-4+3

Also included in: Middle School Science Graphing & Data Analysis Bundle | Real-World Data 6, 7, 8

$5.97

$3.97

Waves and Energy Data Analysis Graphing Bundle | HIGH SCHOOL

Created by
TWFScience

These three waves and energy data graphing activities will help your students understand how wave properties are related, how amplitude and frequency affect sound, and how wavelength, frequency, and energy are connected across the electromagnetic spectrum while building strong graphing and data anal

9th - 12th Graphing, Physical Science, Physics

Also included in: High School Science Graphing and Data Analysis Mega Bundle | Real-World Data Lab

$5.97

$3.97
Resource Depletion & Mining Data Analysis Graphing Bundle | HIGH SCHOOL

Created by
TWFScience

These three natural resources and resource depletion data graphing activities will help your students understand how human resource use affects availability, how consumption compares with production and new discoveries, and how growing demand for copper and lithium is connected to mining and sustain

6th - 9th Graphing, Earth Sciences, Physical Science

NGSS MS-ESS3-1, MS-ESS3-3, MS-ESS3-4

Also included in: High School Science Graphing and Data Analysis Mega Bundle | Real-World Data Lab

$5.97

$3.97
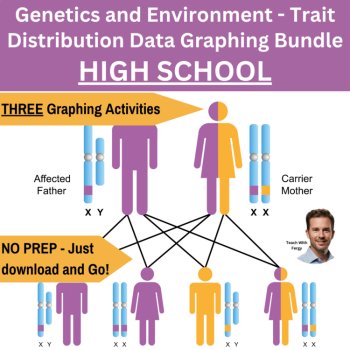
Genetics and Environment - Trait Distribution Data Graphing Bundle | HIGH SCHOOL

Created by
TWFScience

These three genetics and environment data graphing activities will help your students understand how genetic probability predicts inherited traits, why observed trait ratios vary among samples, and how environmental conditions affect the distribution of expressed traits—all while building strong gra

9th - 12th Graphing, Biology

NGSS HS-LS3-2, HS-LS3-3

$5.97

$3.97