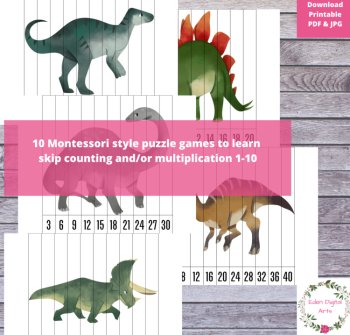
Dinosaurs Dino Fun Simple Puzzles Skip Counting Multiplication Games Crafts

$3.98 (1)

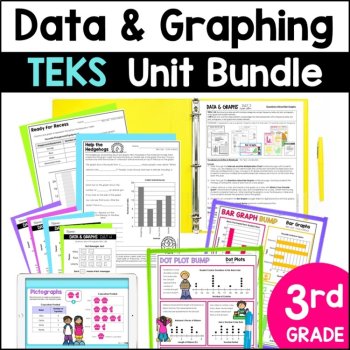
3rd Grade Data and Graphs Math Curriculum - TEKS 3.8A, 3.8B - Graphing
(7 ratings)$40.50 $18.00
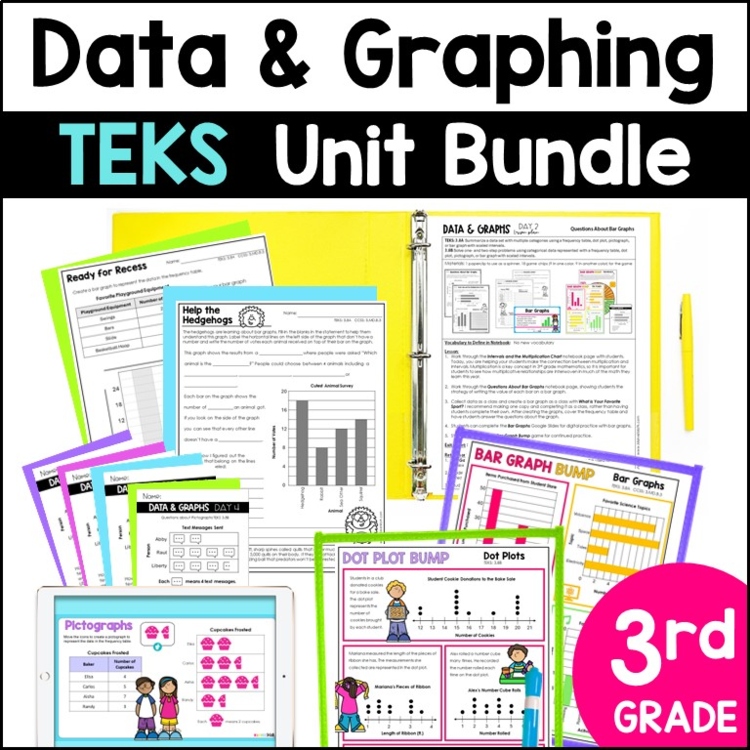
Get BundleEverything you need for your 3rd Grade Data and Graphs Unit! This comprehensive Data & Graphing Curriculum Unit includes scaled bar graphs, pictographs and dot plot activities. This unit bundle has all the resources you need for your daily lessons, math stations, intervention resources, ongoing assessment and test prep!
You and your students will love the incredible activities and resources inside this bundle. These engaging activities will build a strong understanding of bar graphs, pictographs and dot plots while preparing your students for STAAR 2.0.
⭐️ BUNDLE & SAVE ⭐️
This Data & Graphs Unit is part of the 3rd Grade Math Curriculum - Year Long Bundle. Check it out and get everything you need to teach 3rd grade math this year!
What 3rd Grade Data and Graphing topics are covered?
Click on the Preview to get a closer look at everything included.
What's Included in the 3rd Grade Data and Graphing Unit?
The included Data & Graphing resources are designed to work together seamlessly and provide you with plenty of activities to select from for:
What Printable Resources are Included?
What 3rd Grade Data and Graphing Digital Resources are Included?
The following sets of Interactive Google Slides with Movable Pieces are Included. Each set has 15 slides with problems or activities and video instructions for students.
The following digital resources are Self-Grading Google Forms.
A Digital Version of the Data & Graphs Vocabulary Bunting is also included in Google Slides.
Standards Alignment:
This unit is built for the Texas Math TEKS, and all pages are aligned to the TEKS. However, it also covers most Common Core Standards.
The differences between the TEKS and Common Core Data & Graphing Standards:
TEKS
3.8A: Summarize a data set with multiple categories using a frequency table, dot plot, pictograph, or bar graph with scaled intervals.
3.8B: Solve one- and two-step problems using categorical data represented with a frequency table, dot plot, pictograph, or bar graph with scaled intervals.
Common Core
3.MD.B.3: Draw a scaled picture graph and a scaled bar graph to represent a data set with several categories. Solve one- and two-step "how many more" and "how many less" problems using information presented in scaled bar graphs.
___________________________________
Copyright © Marvel Math
Permission to copy for single classroom use only.
Please purchase additional licenses if you intend to share this product.
Report this resource to Linked Through Learning
Reported resources will be reviewed by our team. Report this resource to let us know if this resource breaks our rules.
“Great resource to use with my Multiple Abilities Students. Many different options and easy to understand.”
“This resource is excellent for both students and teachers. I love how complete it is, providing everything I needed to teach this unit in math. Students LOVED taking surveys and using their data to create graphs!”
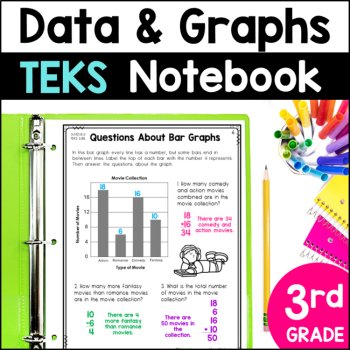
You and your students will love these Easy-to-Use 3rd Grade Data & Graphing Student Notebook Pages. There are engaging pages to teach scaled bar graphs, pictographs, and dot plots with fractions and whole numbers. TEKS 3.8A and 3.8B are thoroughly covered in the included pages.This notebook bec
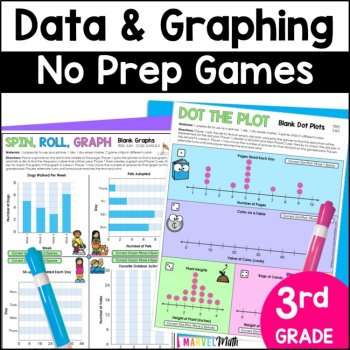
Engage your 3rd graders with this exciting collection of Data and Graphing Games! Dive into scaled bar graphs, pictographs and dot plot activities for a hands-on math adventure. Perfect for practicing TEKS 3.8A and 3.8B.These games are ideal for math stations, tutoring, small groups and summer schoo
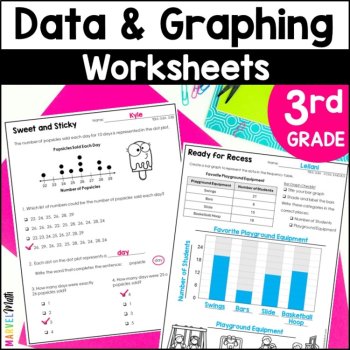
Explore scaled bar graphs, pictographs, and dot plots through engaging worksheets designed to boost comprehension and analytical skills. Perfect for 3rd graders, these worksheets make learning fun and align seamlessly with TEKS 3.8A and 3.8B.What's Included:Table of Contents with 3rd grade Math TEKS
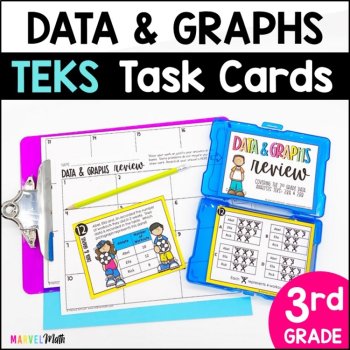
This resource includes 24 TEKS-aligned Printable Task Cards for Bar Graphs, Pictographs, Dot Plots and Frequency Tables. Students will practice representing data in these types of graphs and answer word problems using graphs.Find the digital Google Form version HERE. Both versions have the same ques
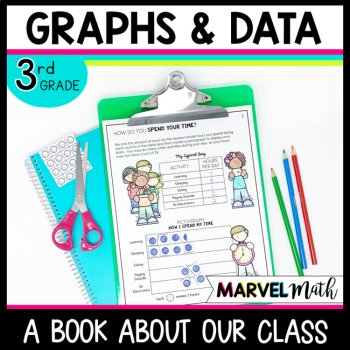
This SUPER FUN Graph and Data Book will give your students meaningful, hands-on experience collecting, reporting, graphing and analyzing data!!! This is a No-Prep resource to help you teach pictographs, vertical and horizontal bar graphs, dot plots, and frequency tables. Students will participate i
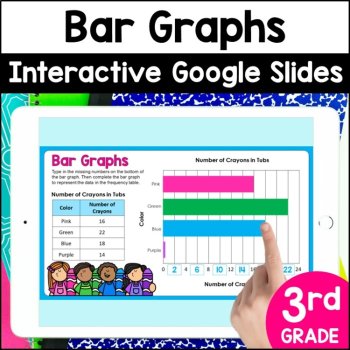
Students will love these fun & engaging slides to Practice Bar Graphs with Scaled Intervals. These interactive slides give hands-on practice moving bars to create bar graphs, making it great for test prep! Other slides in this resource give students practice determining the scaled intervals in b
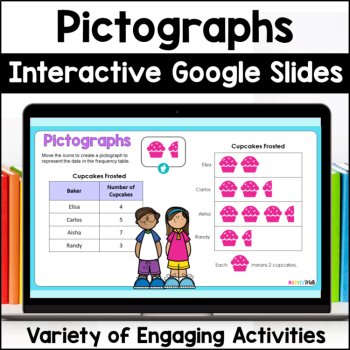
Students will love these Fun & Engaging Google Slides to Practice Pictographs. These interactive slides give hands-on practice moving pictures to create pictographs, finding the value of each category in a pictograph, and answering multi-step questions using data from pictographs. This resource
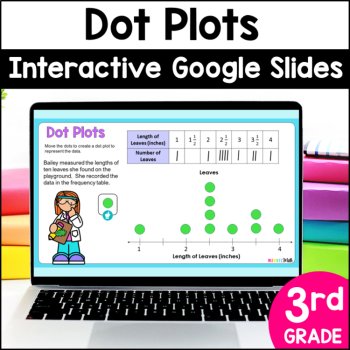
Dive into Digital Fun with these Engaging Google Slides Dot Plot Activities! These interactive slides give Hands-on Practice moving dots to create dot plots with fractions and whole numbers and answering multi-step questions using data from dot plots. This resource seamlessly aligns to TEKS 3.8A and
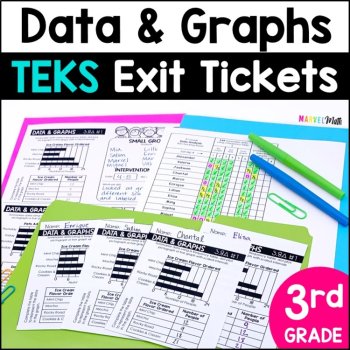
This set of Exit Slips covers all of the 3rd grade Data Analysis TEKS: 3.8A & 3.8B, assessing each with STAAR formatted questions. These exit tickets give you a quick snapshot of student understanding and are an excellent assessment tool to drive your instruction and intervention. This set incl
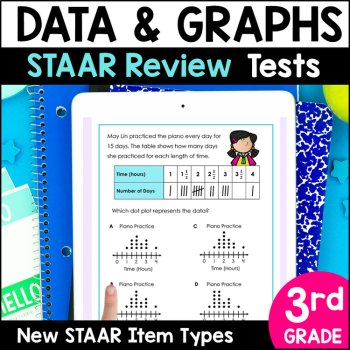
This resource includes 2 ten question Assessments for the Data and Graphs TEKS. The questions are STAAR formatted. Test questions cover Bar Graphs, Pictographs, Dot Plots and Frequency Tables. The assessments are in 2 formats: printable PDF and digital, self-grading Google Forms.The assessments are
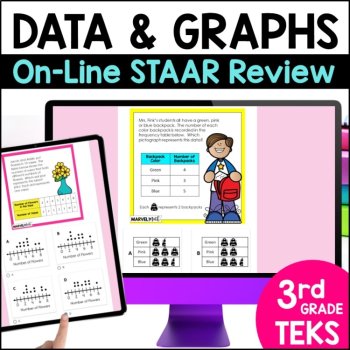
This resource includes 24 TEKS-aligned Digital Task Cards for Bar Graphs, Pictographs, Dot Plots and Frequency Tables that can be assigned for Distance Learning via Google Classroom. These task cards are in a Google Form, which means they are automatically graded when students click submit! I have
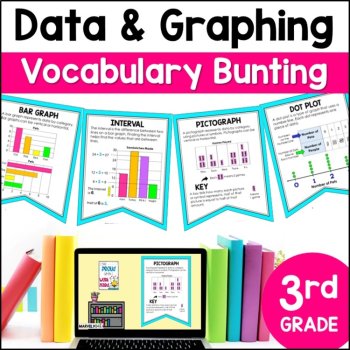
This Data and Graphs Vocabulary Bunting is perfect for your Math Word Wall and will visually motivate you and your students to use precise mathematical language in your classroom! The vocabulary bunting comes in 2 formats: printable PDF to hang on your classroom wall and digital Google Slides that c
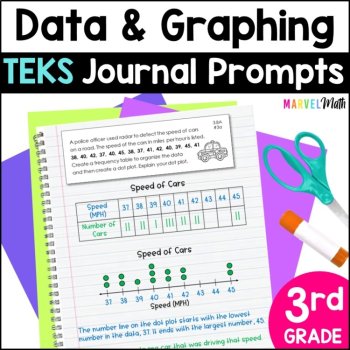
Explore scaled Bar Graphs, Pictographs, and Dot Plots with exciting journal prompts that inspire creativity and critical thinking. Perfect for 3rd graders, these Data and Graphing journal prompts make learning fun and align seamlessly to TEKS 3.8A and 3.8B.I absolutely love using math journals in th
5.0
7
ratings
No reviews match. Try other filters.
No questions yet.
Meet the Seller
In addition to my work in education, I also run a STEM-based Christmas Light Show business. When I'm not creating new math resources or working with teachers, I'm designing and fabricating light shows sequenced to music with my husband and our team. That business came about after our family was featured on ABC's The Great Christmas Light Fight. My son attends the University of Texas, Austin and I'm currently soaking up every last minute with my daughter, a high school senior.
San Antonio, Texas