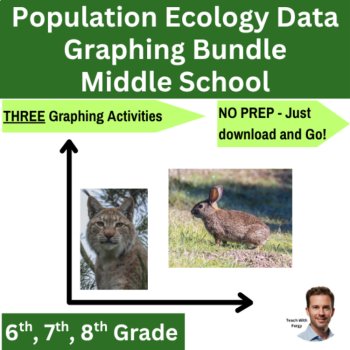
Population Ecology Data Graphing Lab Bundle | 6th, 7th, 8th Population Dynamics
 Created by
TWFScience
These three population ecology data graphing activities will help your students understand how predator and prey populations change over time, how resources affect carrying capacity, and how limiting factors such as food availability and disturbance affect population size while building strong graph
6th - 9th Graphing, Biology, Environment
NGSS MS-LS2-1, MS-LS2-2, MS-LS2-3+5
Also included in: Middle School Science Graphing & Data Analysis Bundle | Real-World Data 6, 7, 8
$5.97
$3.97